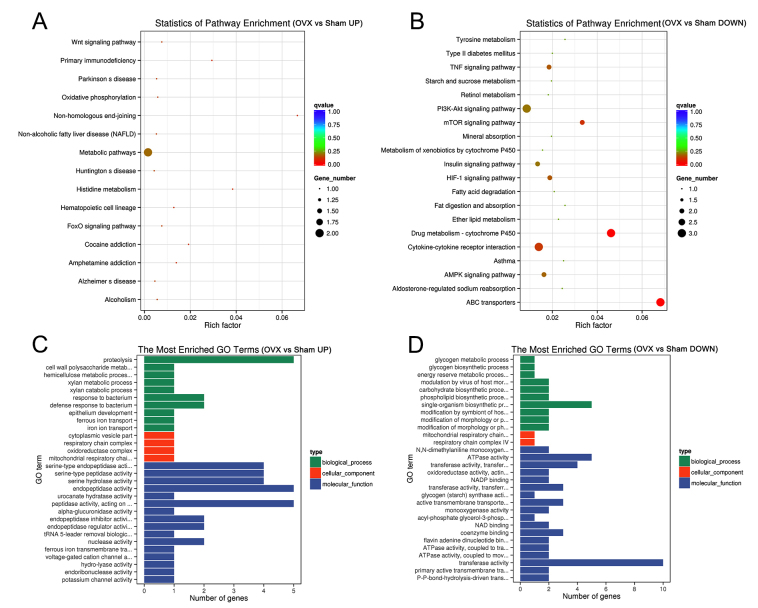
Figure 7.
Bioinformatics analysis of the genetic profile of the first lumbar vertebra from the Sham and OVX groups. (A and B) Statistics of enriched pathways by (A) the upregulated and (B) the downregulated differentially expressed genes in the OVX vs. Sham group. (C and D) The most enriched GO terms (OVX vs. Sham) by (C) the upregulated and (D) the downregulated differentially expressed genes. UP, upregulated; DOWN, downregulated; GO, gene ontology; Fox, forkhead box; PI3K, phosphoinositide-3 kinase; mTOR, mammalian target of rapamycin; TNF, tumor necrosis factor; HIF, hypoxia-inducible factor; AMPK, 5′ AMP-activated protein kinase; OVX, ovariectomy.

