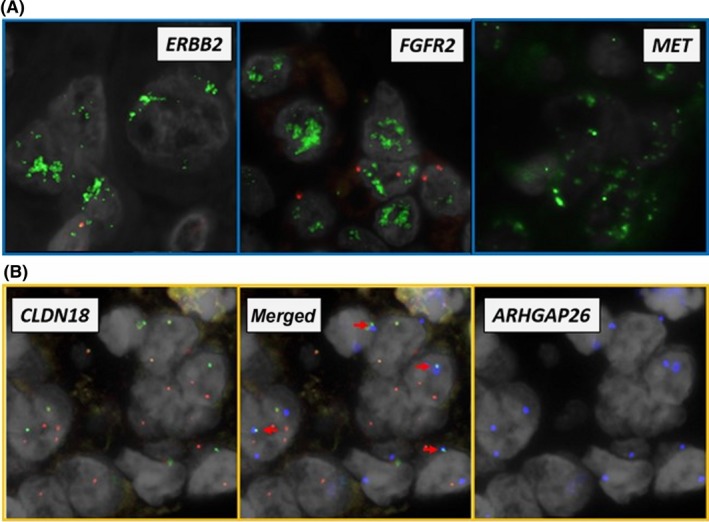
Figure 3.

Examination of gene amplifications and rearrangements in FISH analysis. A, Representative images positive for gene amplification. DNA probes for indicated genes are labeled with green fluorophore. For internal controls, FISH probe to centromeres is labeled with red fluorophore. B, Representative images positive for the CLDN18‐ARHGAP26 fusion gene. The split FISH analysis indicates gene breakage when 2 different fluorophores labeled both sides of the gene fail to colocalize. Note that green (5′ side of CLDN18) and red (3′ side of CLDN18) signals were separated (left panel). The fusion FISH analysis indicates the presence of fusion genes when 2 different fluorophores labeled to fused pairs colocalize. Note that the blue signals from ARHGAP26 (right panel) overlap with green‐labeled CLDN18 in the merged panel (middle panel, arrows)
