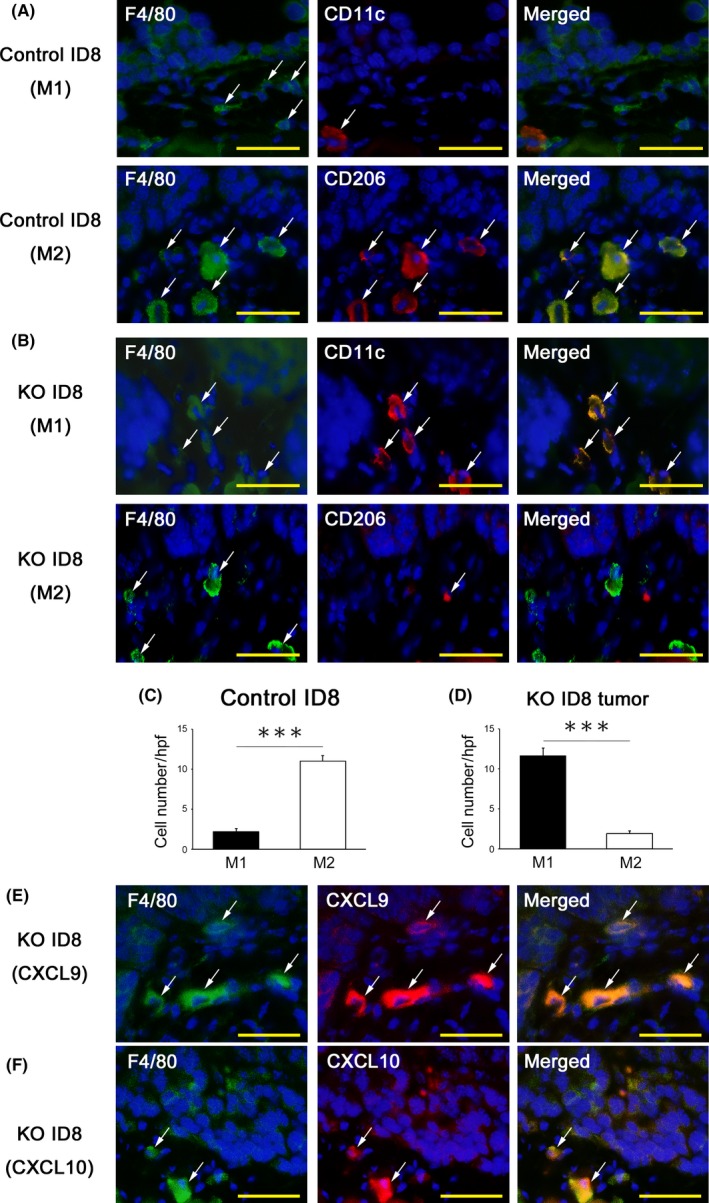
Figure 6.

Identification of macrophage subsets and their chemokine expression in tumor tissues. A, B, The identification of macrophage subsets in tumor tissues. A double‐color immunofluorescence analysis was performed using the pair of anti‐F4/80 and CD11c for the M1 marker, and that of anti‐F4/80 and anti‐CD206 for the M2 marker. Fluorescent images were digitally merged. Nuclear staining is blue. Original magnification, ×400. Bar = 50 μm. C, D, The number of macrophage subsets (M1 and M2 macrophages) in the tumor microenvironment of mice transplanted with programmed cell death ligand 1 (PD‐L1) KO ID8 and control ID8. All values represent the mean ± SE (n = 6 in each group). Statistical significance determined by Student's t test; ***P < .001. E, F, Expression of CXCL9 and CXCL10 at disseminated tumors in PD‐L1‐KO ID8‐inoculated mice. A double‐color immunofluorescence analysis was performed using the pair of anti‐F4/80 and CXCL9 or CXCL10. Fluorescent images were digitally merged. Nuclear staining is blue. Original magnification, ×400. Bar = 50 μm
