Figure 2.

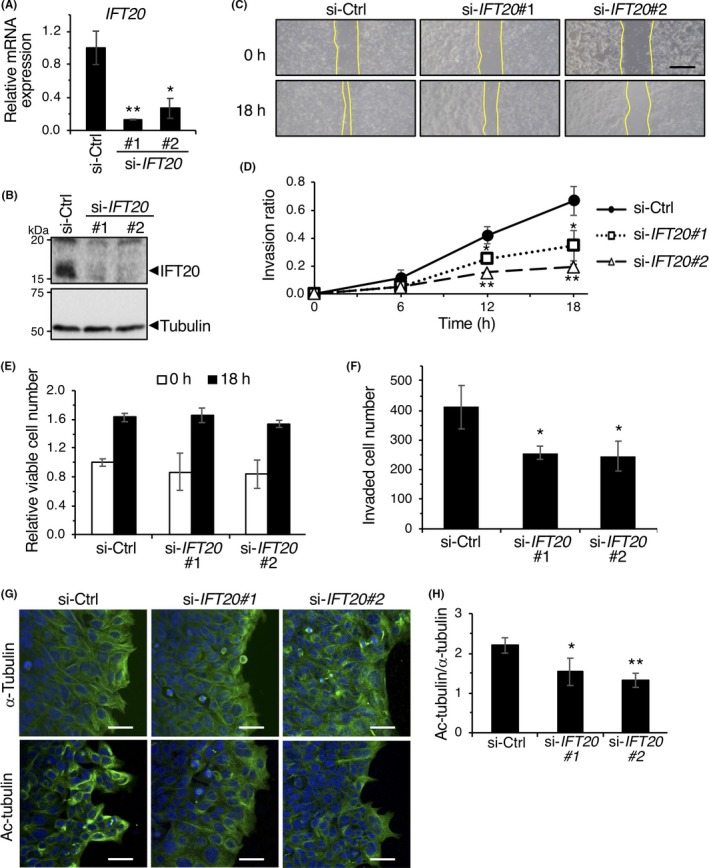
Intraflagellar transport 20 (IFT20) is required for accumulation of acetylated microtubules during collective invasion. A,B, Suppressed mRNA (A) and protein (B) expression of IFT20 in DLD1 cells transfected with siRNAs against IFT20. C,D, siRNA‐transfected DLD1 cells were analyzed by 2‐D invasion assay. Representative phase contrast images of cells before (0 h) and after incubation for 18 h are shown (C). Yellow lines indicate edges of cell layers. Scale bar, 500 μm. Invasion ratios of the respective cells after incubation for 0, 6, 12, and 18 h were determined 2(D). Data are expressed as mean ± SD (n = 3). *P < .05; **P < .005, t test. E, Relative viable cell number of siRNA‐transfected DLD1 cells at 0 and 18 h in 2‐D invasion assay was measured using WST8. Data are expressed as mean ± SD (n = 3). F, siRNA‐transfected DLD1 cells were analyzed by Transwell invasion assay. Cells invaded to the lower surface of the Transwell membranes were counted. Data are expressed as mean ± SD (n = 3). *P < .05, t test. G,H, siRNA‐transfected DLD1 cells were subjected to 2‐D invasion assay for 18 h. Cells were stained with Abs against α‐tubulin or acetylated (Ac)‐tubulin (green) and counterstained with DAPI (blue). G, Representative confocal images of cells. Scale bar, 20 μm. H, Fluorescence intensities of α‐tubulin and Ac‐tubulin in leader cells, normalized by those in follower cells, were quantified, and the ratio of fluorescence intensities of Ac‐tubulin and α‐tubulin were determined. Data are expressed as mean ± SD (n = 3, >30 cells/experiment). *P < .05; **P < .005, t test
