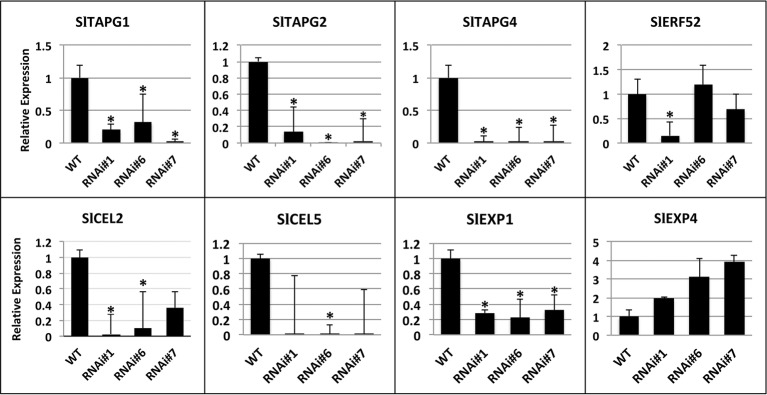
Figure 6.
Expression analysis of SlTAPG1 (polygalacturonase), SlTAPG2, SlTAPG4, SlCEL2, (cellulase), SlCEL5, and SlEXP1 (expansin 1), SlEXP4, SlERF52 genes in AZs of SlP4H3 RNAi lines #1, #6, and #7 and wild type (WT). The relative expression was calculated according to the comparative Ct method by using actin as internal standard. The asterisk indicates statistically significant differences.

