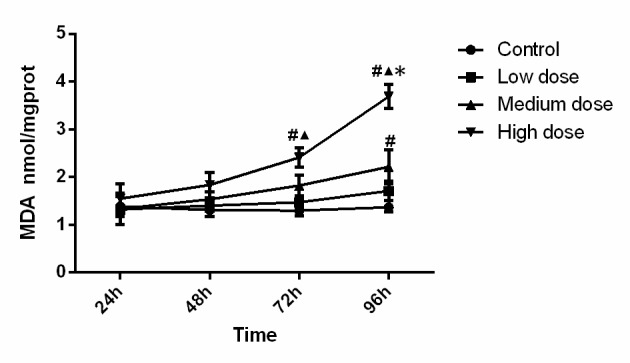
Figure 3.

MDA content in the experimental groups. The MDA content increased along with the increase of isonicotinic acid hydrazide concentration and incubation time. #P<0.05 vs. Control; ▲P<0.05 vs. Low-dose; *P<0.05 vs. medium dose. MDA, malondialdehyde; prot, protein.
