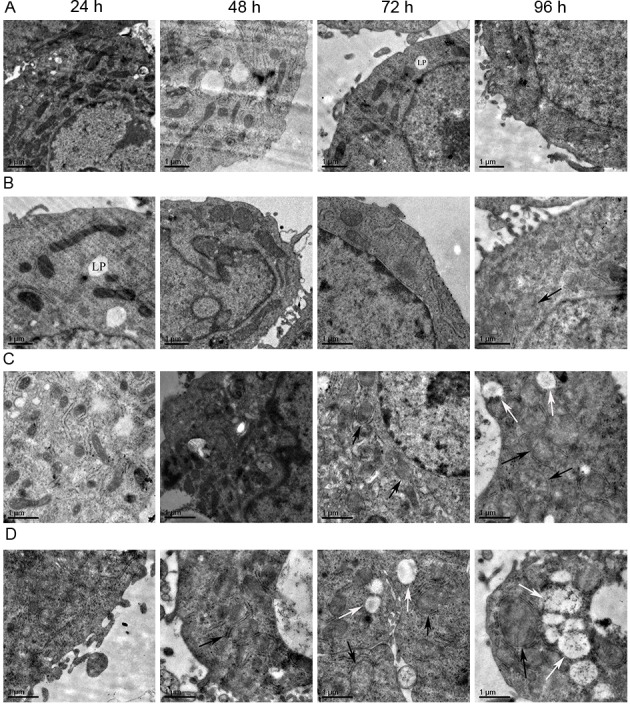
Figure 5.

Electron microscopy images revealing HepG2 cell mitochondrial morphology. (A) Control group (magnification, ×8,000). (B) low-dose group (magnification, ×10,000). (C) medium-dose group (magnification, 10,000). (D) high-dose group (magnification, ×10,000). From left to right the time point is 24, 48, 72 and 96 h. Subfigures of (A-D) showed the morphological changes of mitochondria in different treatment groups at different time points. The morphology of mitochondria notably changed with the increase of dosage and the prolongation of the time. Some mitochondria appeared swollen (black arrows) and some were vacuolated (white arrows). Lipid droplets (LP) were occasionally visible. Scale bar=1 µm.
