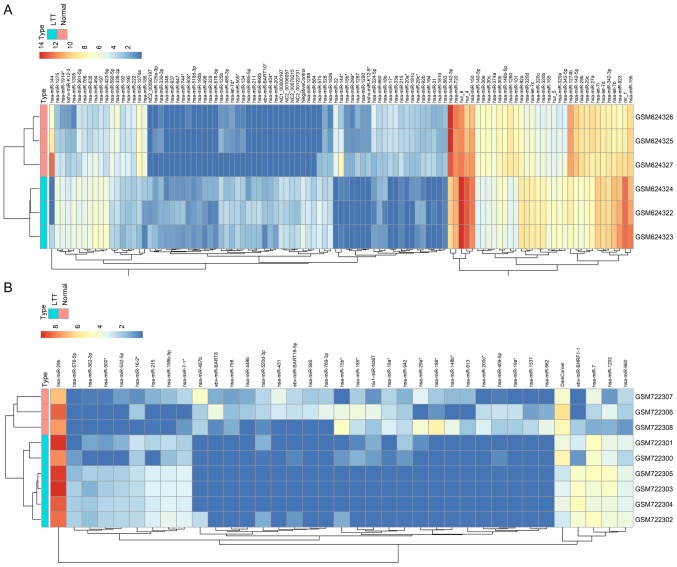
Figure 1.
Hierarchical clustering of the DEMs from patients with and without LTBI. The color scale at the top illustrates the relative expression level of an mRNA. Red represents a high relative expression and blue represents a low relative expression. (A) DEMs of GSE25435. (B) DEMs of GSE29190. DEM, differentially expressed miR; LTB, latent tuberculosis; miR, microRNA; hsa, Homo sapiens.

