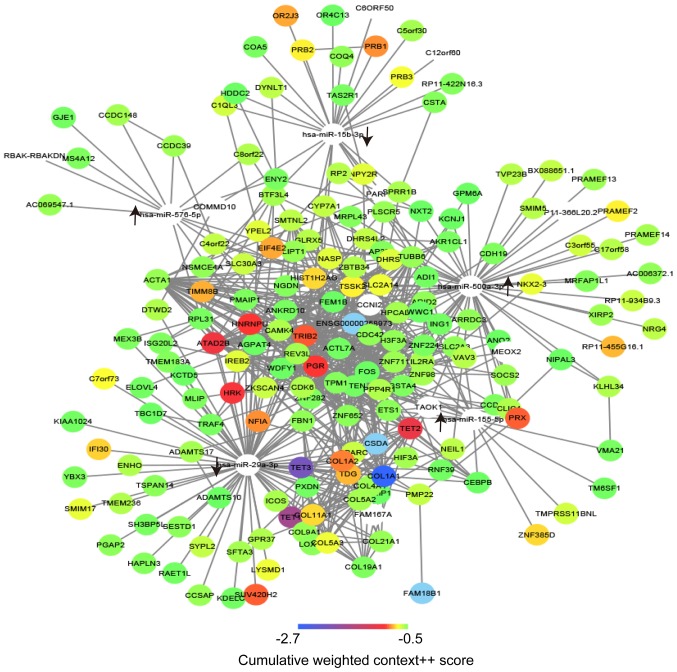
Figure 3.
Regulatory and interaction networks of the differentially expressed miRs and their target genes. The upward arrow indicates the upregulation of the miRs and the downward arrow indicates the downregulation of the miRs. The color scale presented at the bottom illustrates the cumulative weighted context++ scores of the target genes. miR, microRNA; hsa, Homo sapiens.

