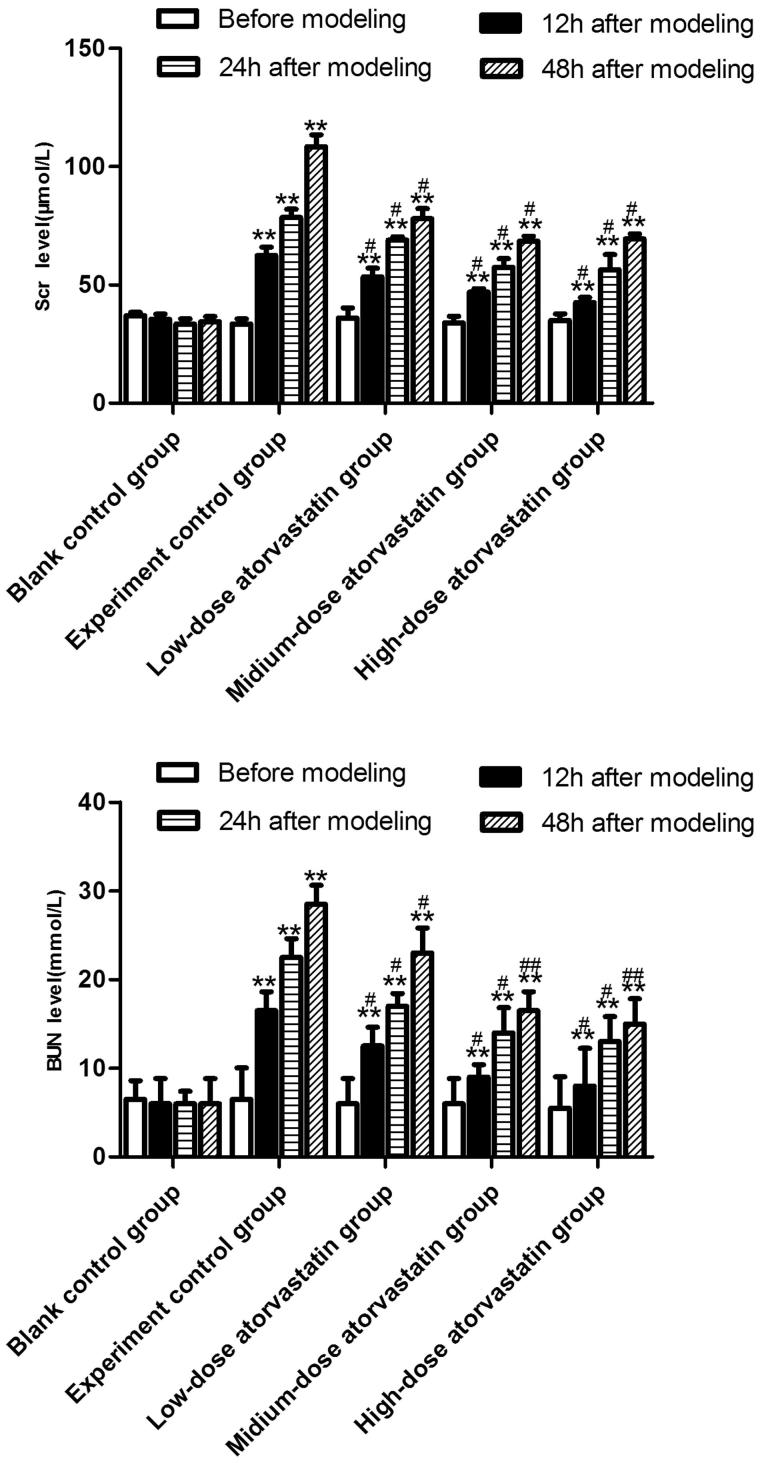
Figure 1.
Comparison of changes in the Scr or BUN level 0, 12, 24, and 48 h after contrast agent injection. **Src or BUN level was significantly difference compared to the blank control group (p < .01). # or ## Src or BUN level was significantly reduced compared to the experimental control group (#p < .05; ##p < .01).

