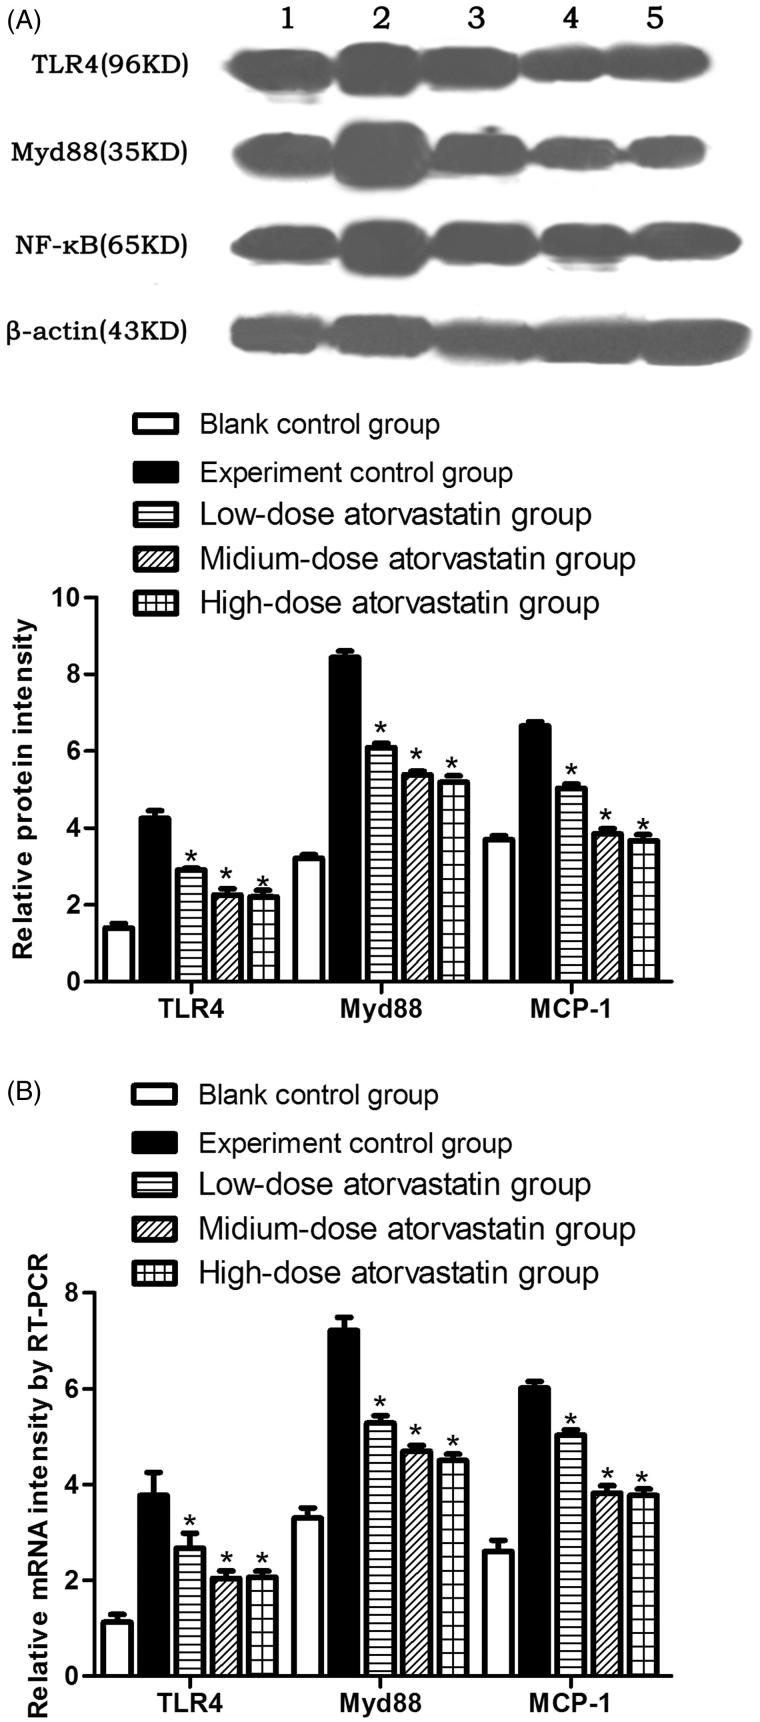
Figure 3.
(A) Relative TLR4, Myd88, and NF-κB signaling pathway protein expression levels in the different experimental groups. (B) Relative TLR4, Myd88, and NF-κB mRNA expression levels in the different experimental groups * indicates p < .05 compared to the experimental group. All variables were evaluated 48 h after the induction of AKI. (1: Blank control group; 2: Experiment control group; 3: Low-dose atorvastatin group; 4: Medium-dose atorvastatin group; 5: High-dose atorvastatin group.).

