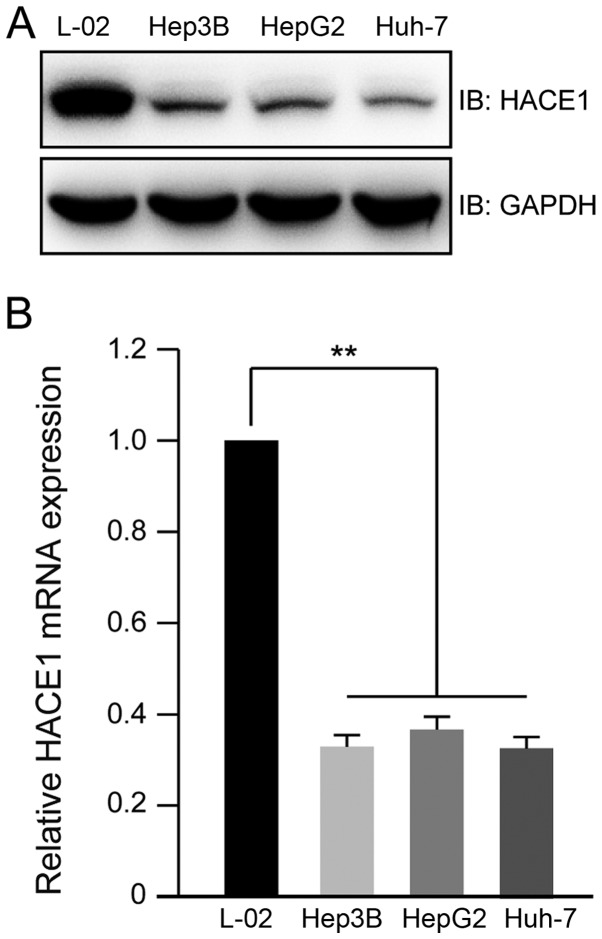
Figure 1.
Expression profile of HACE1 in normal liver and liver cancer cell lines. (A) Protein expression profile of HACE1 in normal liver and liver cancer cell lines detected by immunoblotting. L-02 is a normal liver cell line; Hep3B, HepG2 and Huh-7 are liver cancer cell lines. (B) mRNA expression levels of HACE1 in normal liver and liver cancer cell lines detected by reverse transcription-quantitative polymerase chain reaction. Data are presented as the means ± standard deviation of three independent experiments and were analysed using one-way analysis of variance with Tukey's post hoc test. **P<0.01. HACE1, HECT domain and ankyrin repeat containing E3 ubiquitin protein ligase 1; IB, immunoblotting.

