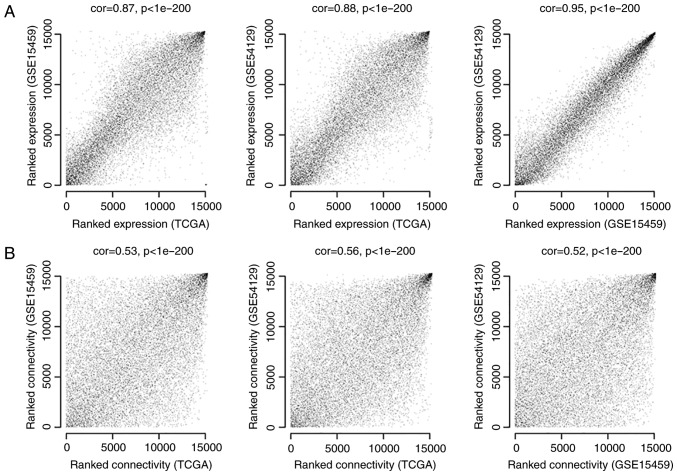
Figure 1.
The correlation analysis of the datasets. (A) Expression correlations and (B) connection correlations between the RNAs of every two entries of TCGA dataset, GSE15459 and GSE54129. Left, middle, and right diagrams represent TCGA-GSE15459, TCGA-GSE54129 and GSE15459-GSE54129, respectively. TCGA, The Cancer Genome Atlas; GSE, gene set enrichment.

