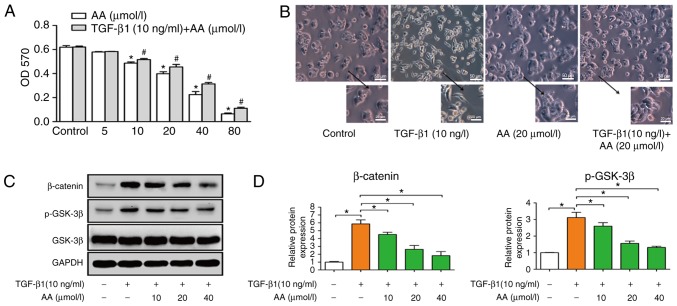
Figure 1.
(A) Effects of AA on the viability of TGF-β1-treated A549 cells. *P<0.05, compared with the AA control group; #P<0.05, compared with TGF-β1 + AA control group. (B) Morphological alterations of A549 cells (magnification, ×400) and (C) protein expression levels of β-catenin, p-GSK-3β and GSK-3β before and after TGF-β1 and AA treatment. (D) Semi-quantitative analysis of (C). *P<0.05. AA, asiatic acid; GSK-3β, glycogen synthase kinase-3β; OD, optical density; p-GSK-3β, phosphorylated-GSK-3β; TGF-β1, transforming growth factor-β1.

