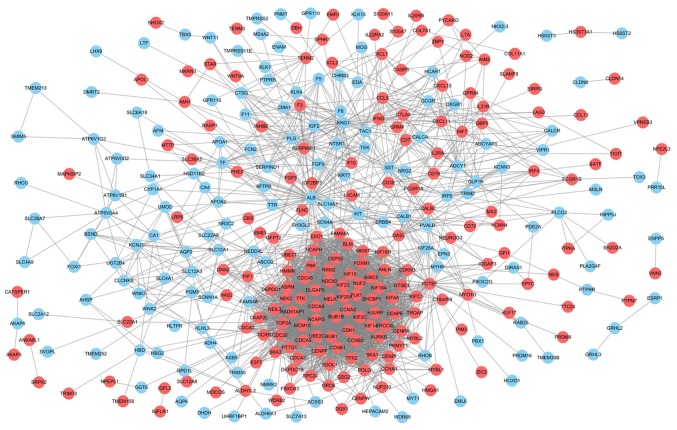
Figure 3.
A graphic representation of the protein-protein interaction network based on differentially expressed genes of clear cell renal cell carcinoma between the metastasis and non-metastasis group. Red nodes indicate upregulated genes and light blue nodes indicate downregulated genes in the metastasis group.

