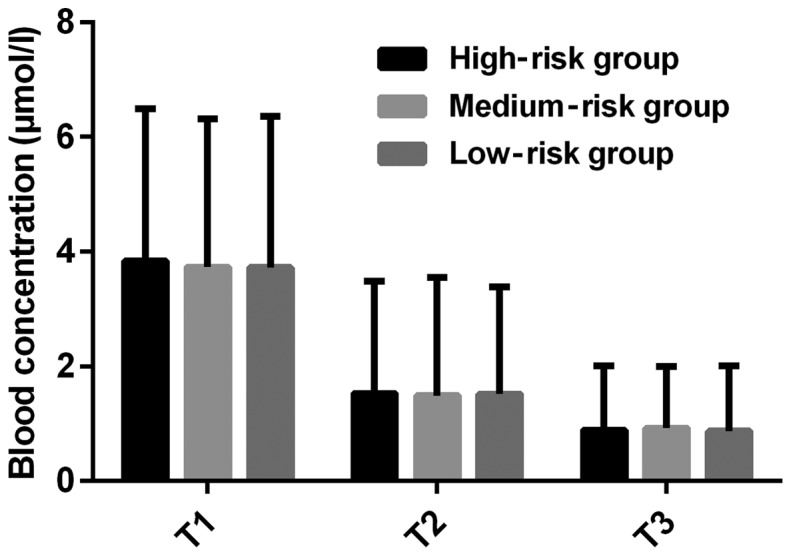
Figure 3.

Plasma concentrations of ALL children with different disease courses. There was no significant difference in plasma concentration at T1, T2 and T3 between the three groups (P>0.05). The plasma concentration at T2 was lower than that at T1, and at T3 was lower than at T2 in all the three groups (P<0.05). ALL, acute lymphoblastic leukemia.
