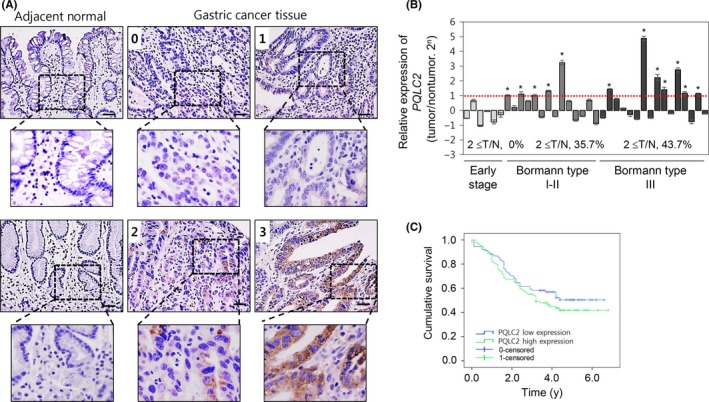
Figure 1.

Expression of PQLC2 in gastric cancer (GC) tissues and cells. A, Immunohistochemical analysis of PQLC2 in GC and adjacent normal tissues (Chungnam National University Hospital, Daejeon, Korea). Scale bar = 50 μm. Tumors were classified based on staining intensity: 0, no staining; 1, weak; 2, intermediate; and 3, strong. B, Relative expression levels of PQLC2 in GC and adjacent normal tissues from 34 GC patients, as determined by RT‐PCR (n = 36). GAPDH served as an internal control. According to Bormann's classification, patients were grouped into early stage, BI, BII, and BIII. C, Survival curve of GC patients according to PQLC2 expression. Patients with high PQLC2 expression showed a worse 5‐y survival rate compared with patients with low PQLC2 expression (P = .023, log‐rank test)
