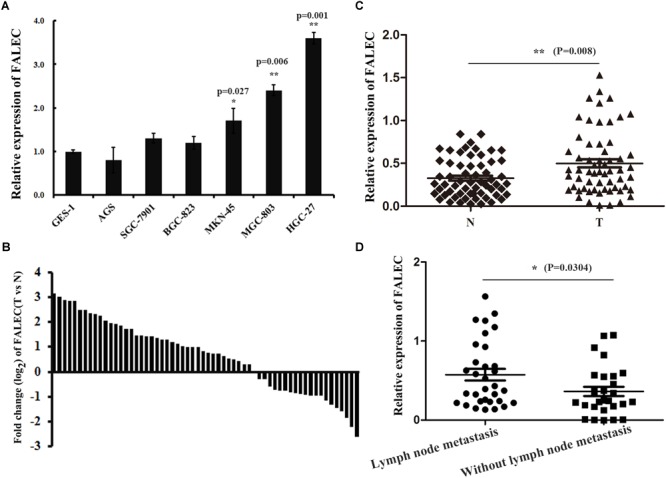
FIGURE 1.

The expression of FALEC was upregulated in GC cell lines and tissues. (A) Relative expression of FALEC in GC cell lines and immortalized normal gastric epithelial cell line (GES-1) was examined by qRT-PCR. (B) The fold change (log2) of FALEC expression between 60 pairs of GC and adjacent normal tissues was measured by qRT-PCR. (C) FALEC expression in GC tissues and paired adjacent normal tissues were examined by qRT-PCR (n = 60), T (Tumor) and N (Non-tumor). (D) Patients with lymph node metastasis showed significantly higher levels of FALEC compared with no lymph node metastasis. ∗P < 0.05, ∗∗P < 0.01.
