
FIGURE 3.
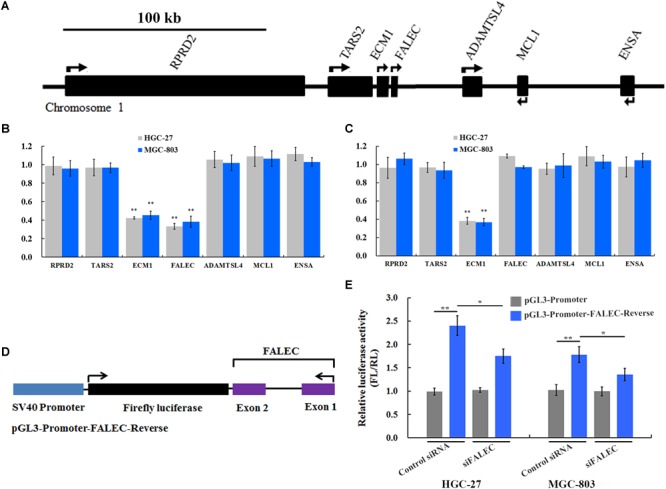
FALEC modulated ECM1 expression by exerting its enhancer-like function in cis. (A) The relative loci of genes adjacent to FALEC. The scale bar represents 100 kb. (B) Depletion of FALEC specifically decreased expression of protein-coding gene ECM1 in HGC-27 and MGC-803 cells. (C) siRNA-induced knockdown of the ECM1 did not affect the transcription of its neighboring genes. ∗∗P < 0.01. (D) Diagram of the FALEC DNA sequence cloned down-stream of Firefly luciferase in a pGL3-Promoter vector (pGL3-Promoter-FALEC-Reverse). (E) FALEC inserts result in a significant enhancement of transcription in GC cells, and depletion of FALEC resulted in a significant decrease in transcriptional enhancement compared with control in HGC-27 and MGC-803 cells. ∗P < 0.05, ∗∗P < 0.01.