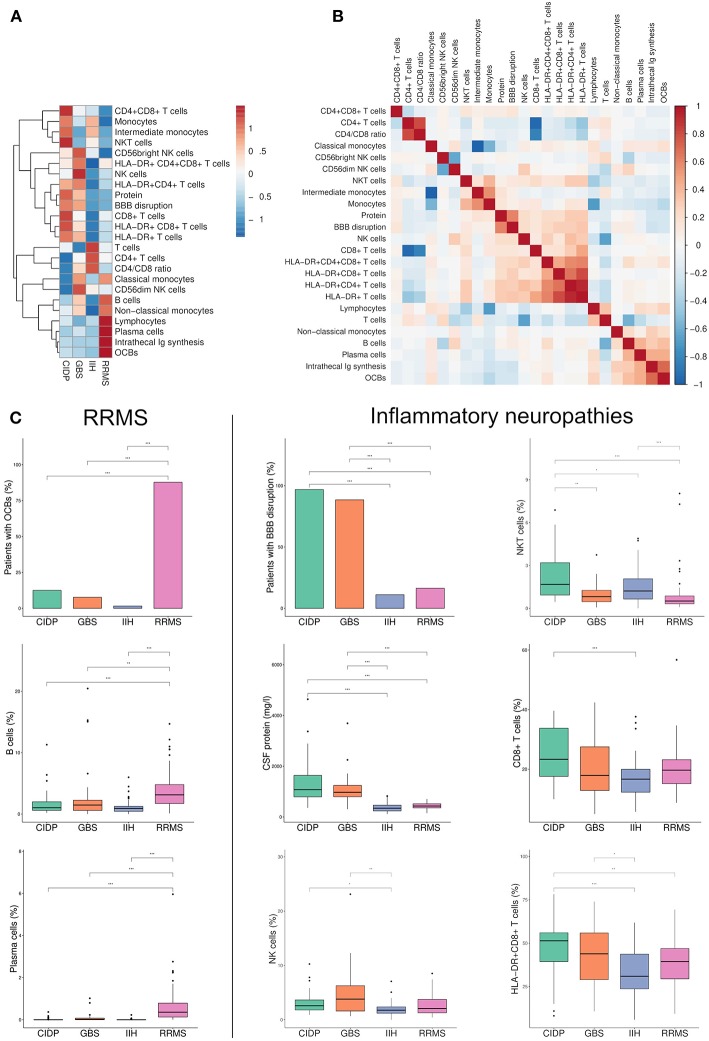
Figure 1.
Flow cytometry identifies new parameters to discriminate between immune-mediated neuropathies. (A) Heatmap depicting row mean of each CSF parameter per row calculated for chronic inflammatory demyelinating neuropathy (CIDP), Guillain-Barré syndrome (GBS), relapsing-remitting multiple sclerosis (RRMS) and idiopathic intracranial hypertension (IIH). The means were scaled and centered for each row by subtracting the column means from their corresponding column and dividing the columns by their standard deviations. Next, hierarchical clustering was performed with complete linkage method and Euclidean distance measure and visualized in a heatmap. (B) A correlation matrix of the investigated parameters was calculated with Spearman's rank correlation coefficient. Correlations coefficients were clustered hierarchically with the single linkage method and Euclidean distance measure. The correlation coefficients are colored according to the value. Positive correlations are displayed in red, negative correlations are colored in blue. (C) Box plots and bar plots of selected CSF parameters categorized by diagnosis. RRMS-related markers are shown on the left, markers related to inflammatory neuropathies are displayed on the right. Boxes indicate the lower quartile, median, and upper quartile with whiskers extending to the furthest value within 1.5 times the interquartile range of the box. Outliers are identified individually. The statistical significance of the results was determined using Kruskal-Wallis test and the Dunn test as a post hoc test. Correction for multiple testing was performed by Benjamini-Hochberg's false discovery rate correction. *p < 0.05, **p < 0.01, ***p < 0.001. BBB, blood-brain barrier; OCBs, oligoclonal bands; Ig, immunoglobulin.

