
Figure 2.
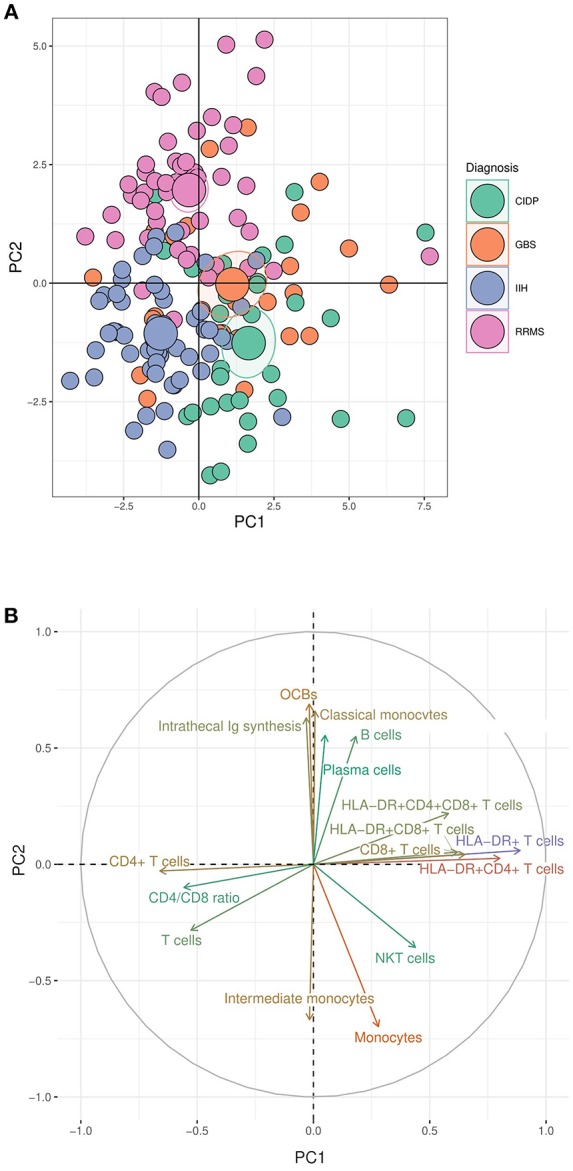
Dimensionality reduction reveals distinct immune cell profiles of inflammatory neuropathies. (A) Principal component (PC) analysis (PCA) was performed using data from patients with chronic inflammatory demyelinating polyneuropathy (CIDP), Guillain-Barré syndrome (GBS), relapsing-remitting multiple sclerosis (RRMS), and idiopathic intracranial hypertension (IIH). Each circle represents a single patient; larger circles represent the group mean. The ellipses around each group mean point represent the confidence intervals. (B) The top 16 parameters contributing to PC1 and PC2 in the PCA are depicted. A long distance between a variable and the origin indicates a major influence of the corresponding variable on the PC. OCBs, oligoclonal bands; Ig, immunoglobulin.