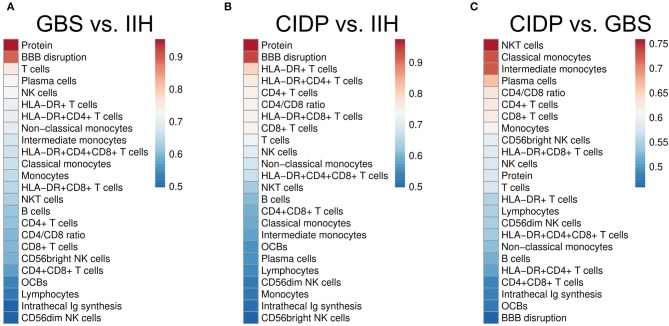
Figure 3.
CSF parameters differentiate inflammatory neuropathies with good confidence. Receiver operating characteristics (ROC) analysis was performed for each CSF parameter in different subsets. Heatmaps depict the color-coded values of the area under the curve (AUC) of the ROC analyses of different subsets sorted by size. (A) Guillain–Barré syndrome (GBS) vs. idiopathic intracranial hypertension (IIH). (B) Chronic inflammatory demyelinating neuropathy (CIDP) vs. IIH. (C) CIDP vs. GBS. BBB, blood-brain barrier; OCBs, oligoclonal bands; Ig, immunoglobulin. Please note the different color scales.

