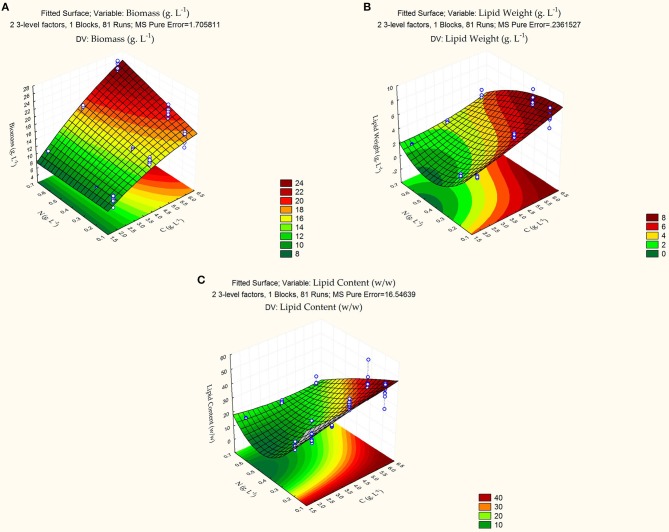
Figure 1.
3D Response surface plot of the combined effects of carbon and nitrogen levels on (A) growth (g/L), (B) lipid weight (g/L), and (C) lipid content (g lipid weight/g dry yeast cell weight). Gradient legends display extent of measured factor. White points mark measured levels on which the Box-Behnken model was built.

