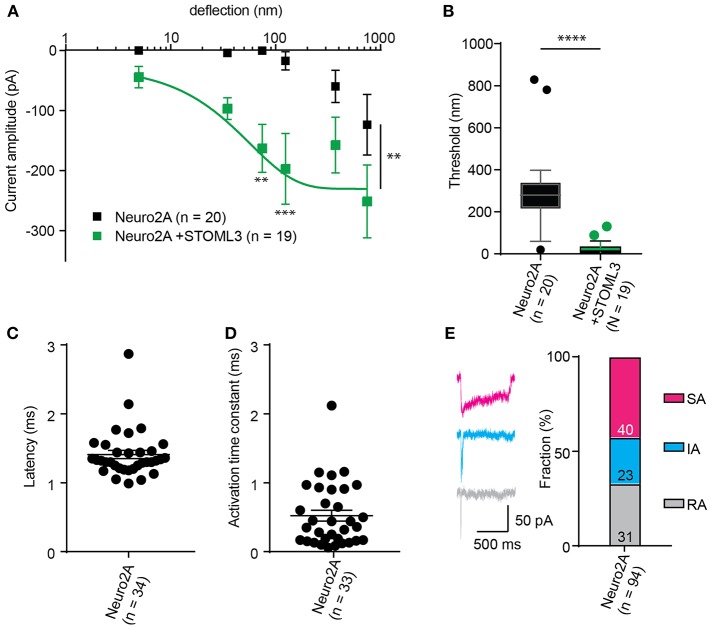
Figure 5.
Representative data collected using Neuro2A cells. (A) Stimulus-response curve generated from Neuro2A cells (endogenously expressing PIEZO1). Overexpression of STOML3 in these cells leads to a sensitization of the MA currents (Ordinary Two-way ANOVA, n = 19 cells and 20 cells, respectively, curve comparison **P = 0.0032, post-hoc analysis of individual bins **P = 0.0043, ***P = 0.001). Boltzmann sigmoidal fit of Neuro2A + STOML3 data (green fit line) estimates a half maximal response of ~15 nm. (B) An analysis of the Neuro2A cells vs. Neuro2A cells + STOML3 indicates that STOML3 significantly reduces activation threshold of deflection-activated currents in these cells (Mann Whitney U-Test, ****P < 0.0001, n = 19 cells and 20 cells, respectively). Data plotted as box and whiskey plots, Tukey. (C) Latency of deflection activated currents in Neuro2A cells. (D) Activation time constant of deflection activated currents in Neuro2A cells. (E) Example traces of deflection activated currents in Neuro2A cells highlighting the variability in inactivation kinetics, classed as RA (τ2 < 5 ms), IA (5 < τ2 < 50 ms), or SA (τ2 > 50 ms or non-inactivating). Categorical plot of percentage of deflection activated currents in Neuro2A cells that are classed as RA, IA, or SA (numbers correspond to number of cells in each group, total n = 94). A subset of these data was previously published (Poole et al., 2014).

