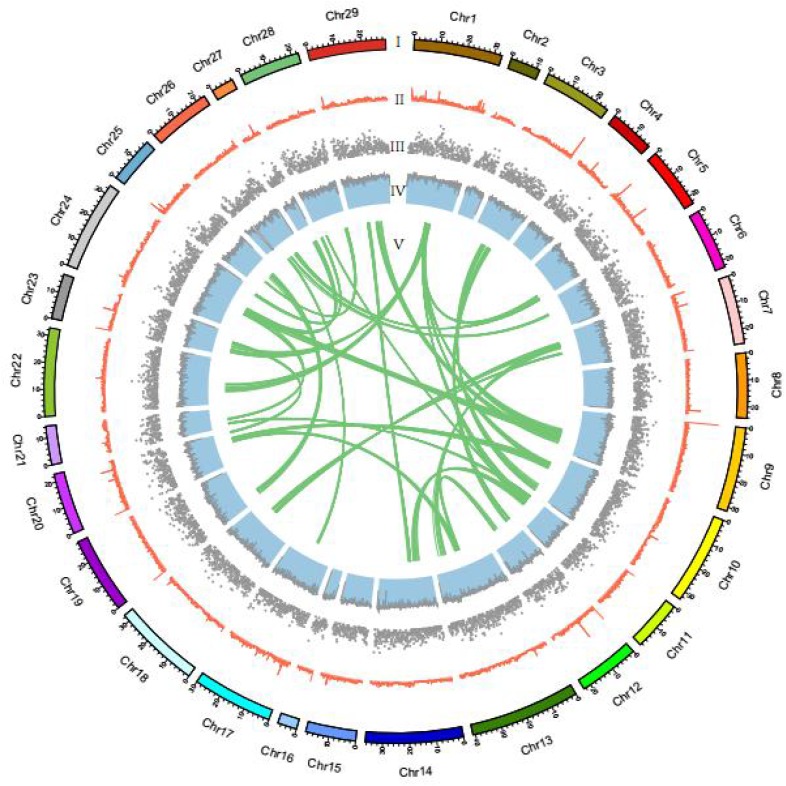
FIGURE 4.
Circos atlas representation of the pseudo-chromosome information. (I) The length of each pseudo-chromosome. (II) Density of SNP distribution in each 100-kb genomic interval. (III) Density of gene distribution in each 100-kb genomic interval. (IV) GC content of 100-kb genomic intervals. (V) Schematic presentation of major interchromosomal relationships in the channel catfish genome.

