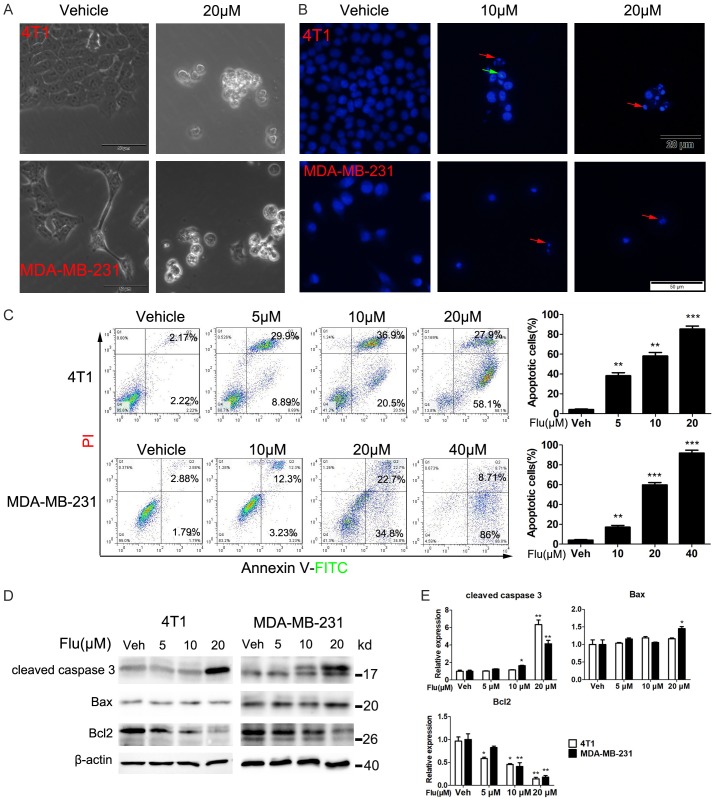
Figure 3.
Flu induced apoptosis in 4T1 and MDA-MB-231 cells. (A and B) Effects of Flu on the morphology of 4T1 and MDA-MB-231 cells. (A) The cells were treated with 20 µM Flu for 48 hours. Then, bright-field microscope images of the cells were taken. The scale bars represent 50 μm. (B) Cancer cell nuclear alterations after Flu treatment for 48 hours. 4T1 and MDA-MB-231 cells were treated with indicated concentrations of Flu or vehicle for 48 hours. Then, the cells were stained with Hoechst 33258 and analyzed by fluorescence microscope. The red and green arrows indicated nuclear fragmentation and condensed nuclei, respectively. The scale bars represent 20 μm and 50 μm for 4T1 and MDA-MB-231 cells, respectively. (C) The apoptosis of 4T1 and MDA-MB-231 cells after Flu treatment were quantitatively analyzed by FCM. Cells were treated with indicated concentrations of Flu or vehicle for 72 hours and then labeled with AnnexinV-FITC and PI followed by FCM analysis. Images shown are representatives of three independent experiments. Quantified values are shown to the right of each cell line. (D) Expression levels of key apoptosis-related proteins were detected by western blotting. Cells were treated with vehicle or indicated concentrations of Flu for 72 hours. Then, the expression levels of cleaved caspase-3 and Bcl-2 family proteins were determined. Images presented are representatives of three independent experiments. (E) Expressions of the protein were quantified using Image J and normalized against β-actin expression. *P<0.05; **P<0.01; ***P<0.001.

