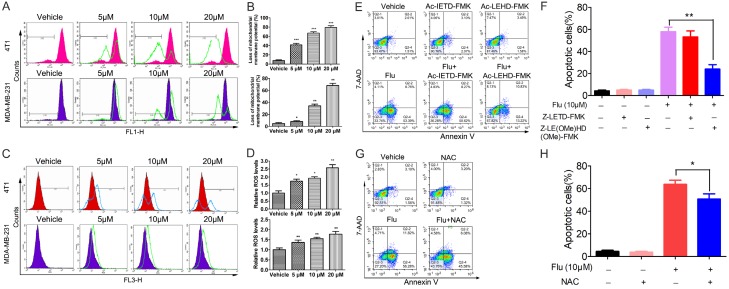
Figure 4.
Effects of Flu on the intrinsic apoptosis pathway. (A and B) Flu decreased the ΔΨm in TNBC cancer cells. 4T1 and MDA-MB-231 cells were treated with vehicle or indicated concentrations of Flu for 24 hours and then stained with Rh123 to measure the changes of ΔΨm by FCM. (A) Images shown are representative of three independent experiments. (B) Quantified results are shown on the right. (C and D) Flu treatment increased ROS levels in TNBC cancer cells. After treatment with indicated concentrations of Flu for 12 hours, 4T1 and MDA-MB-231 cells were incubated with 10 μM DCFH-DA. Intracellular ROS levels were then measured as DCF fluorescence by FCM. (C) Images shown are representative of three independent experiments. (D) Quantified results are shown on the right. (E and F) 4T1 cells were treated with 10 μM Flu alone or in combination with Z-LE(OMe)HD(OMe)-FMK (caspase-9 inhibitor) or in combination with Z-LETD-FMK (caspase-8 inhibitor) for 72 hours. Then the apoptosis of the cells was measured by FCM after AnnexinV-PE and 7-AAD labeling. (E) Images shown are representatives of three independent experiments. (F) Quantified values are shown on the right. (G and H) 4T1 cells were pretreated with 2 mM NAC for 1 h and then treated with 10 μM Flu for 72 hours. The apoptosis of the cells was measured after AnnexinV-PE and 7-AAD labeling. (G) Images shown are representatives of three independent experiments. (H) Quantified values are shown on the right. *P<0.05; **P<0.01, ***P<0.001.

