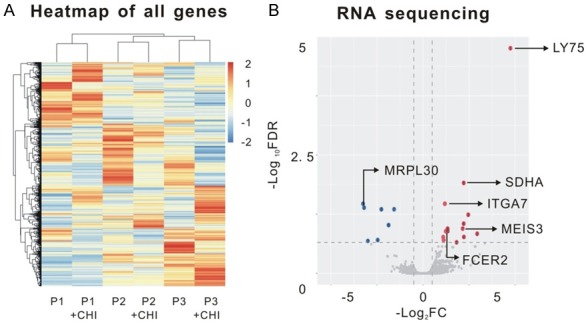
Figure 1.

Genes regulated by chidamide in MM which were screened by RNA sequencing. A. Schematic of RNA sequencing analysis on bone marrow samples of 3 MM patients. BMMCs were isolated by Ficoll centrifugation from patients and then cultured with 6 μM chidamide or DMSO for 24 hours. B. Volcano plots of the genes of differential expression. The differentially expressed genes were plotted as blue (down-regulated genes after chidamide treatment) and red (up-regulated genes after treatment) points and other genes were indicated as gray points. Non-coding genes were excluded and top six genes which were relevant to malignancies were chosen by previous references.
