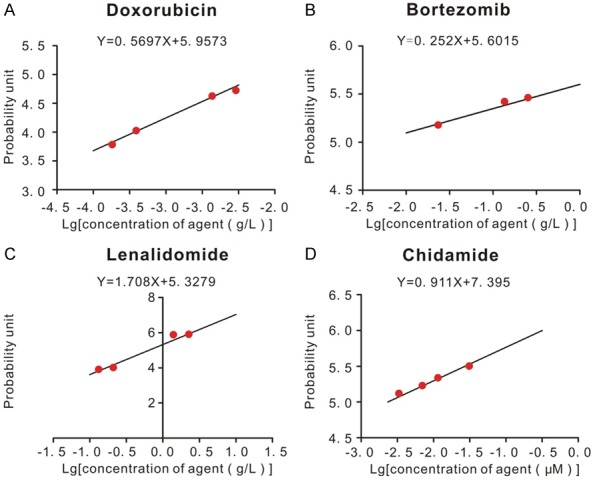
Figure 4.

Dose-response curves of doxorubicin, bortezomib, lenalidomide and chidamide in H929 cells. CCK8 assay was used to determine the dose-response curves of agents. 100 μL 5*105/L H929 cells were put into 96-wells plate. Different concentrations of agents were added to wells respectively for 24 h. CCK8 assay was used as described in Materials and Methods. Apoptosis rates of cells induced by agents were converted to probability unit based on percentage-probability unit chart. The IC50 concentration of each agent was the corresponding value at the probability unit of 5. A. Dose-response curve of doxorubicin. B. Dose-response curve of bortezomib. C. Dose-response curve of lenalidomide. D. Dose-response curve of chidamide.
