Figure 6.

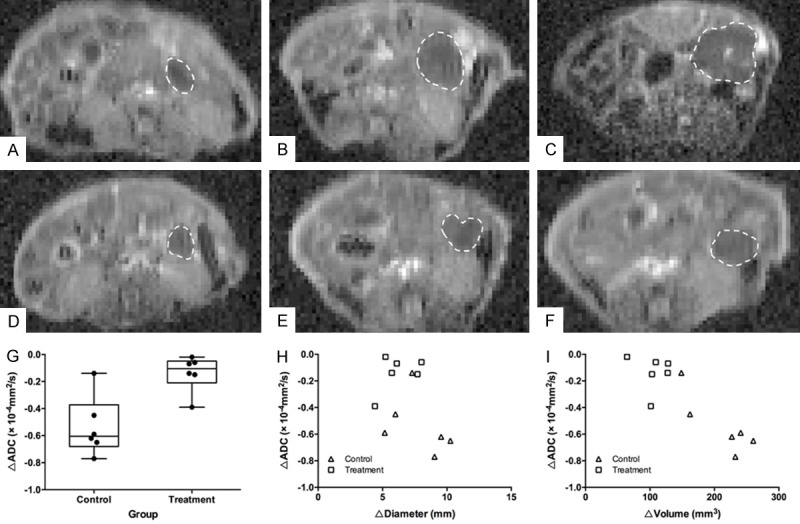
ADC measurement on ADC maps of DW-MRI. (A-C) Representative axial ADC maps of one pancreatic tumor (dash line) in the control group at one week (A), three weeks (B) and five weeks (C) after initiation of treatment. (D-F) Representative axial ADC maps of one pancreatic tumor (dash line) in the treatment group at one week (D), three weeks (E) and five weeks (F) after initiation of treatment. (G) A box plot of ΔADC for the treatment and control group (error bars indicate SD, and dots indicate individual values). ΔADC of the pancreatic tumor in the treatment group was significantly higher than that in the control group (P = 0.004). (H) A scatter plot of the correlation between the change in the longest diameter (Δdiameter) and the change in ADC (ΔADC) after five weeks of treatment. There was no significant correlation between ΔADC and Δdiameter (r = -0.440, 95% CI, -0.848 to 0.509, P = 0.152). (I) A scatter plot of the correlation between the change in tumor volume (Δvolume) and the change in ADC (ΔADC) after five weeks of treatment. There was a very strong negative correlation between ΔADC and Δvolume (r = -0.882, 95% CI, -0.967 to -0.701, P < 0.0001).
