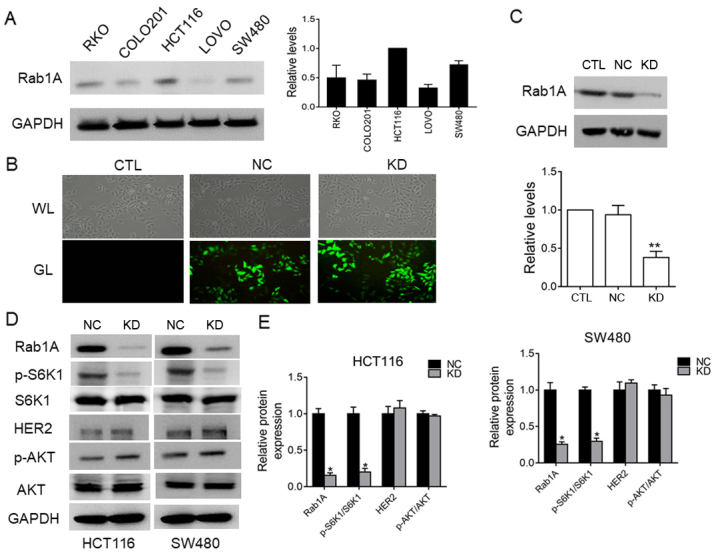
Figure 6.

Rab1A expression in five colorectal cancer cell lines (HCT116, SW480, LOVO, COLO201 and RKO) and the relationship between Rab1A and p-S6K1 expression in HCT116 cells and SW480 cells. (A) Western blot analysis of Rab1A expression levels in five colorectal cancer cell lines. The intensity of the bands was determined by densitometric analysis. (B) Fluorescence microscopic analysis of the transfection efficiency in the untreated (CTL), shRab1A (KD) and negative control shRNA (NC) groups. (C) Western blot analysis of Rab1A expression in the shRab1A (KD), negative control shRNA (NC) and untreated (CTL) groups. The results were quantitatively analyzed based on grayscale values. (D) The protein levels of Rab1A/GAPDH, HER2/GAPDH, p-AKT/AKT and p-S6K1/S6K1 were detected by western blotting in the SW480 cells/HCT116 cells transfected with shRab1A (KD) and negative control shRNA (NC). (E) The results were quantitatively analyzed with gray values in HCT116 cells and SW480 cells. *P<0.05, **P<0.01.
