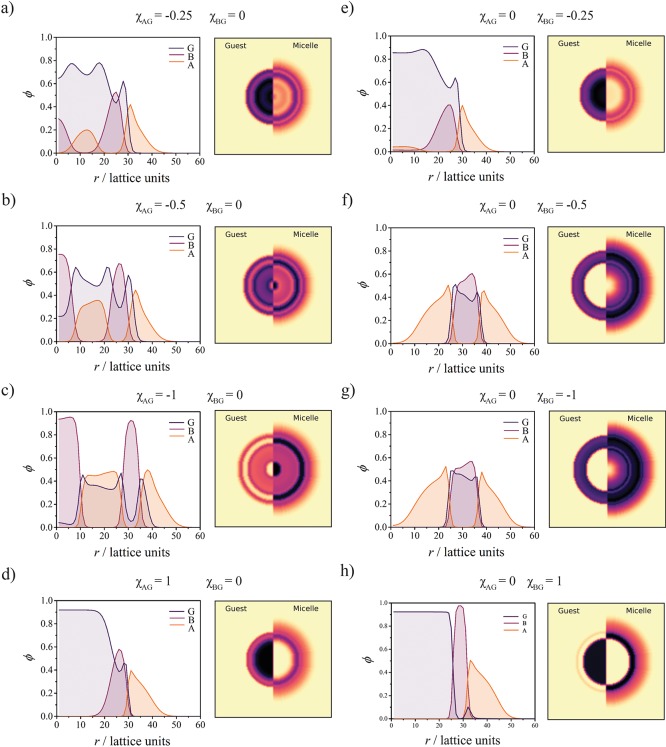
Figure 7.
Radial concentration profiles ϕ(r) and resulting two-dimensional (2D) representations showing the structures of the micelle–guest complex at ϕG* = 9.6 × 10⁻³ (χGS = 2) and ϕG = 2 × 10⁻³ for different values of the interaction parameters, indicated at the top of each profile. The 2D representation of the concentration profiles provides the volume fraction of the guest (G) molecules (left) and the volume fraction of the block copolymers. The different panels (a–h) are referred to in the main text (right).

