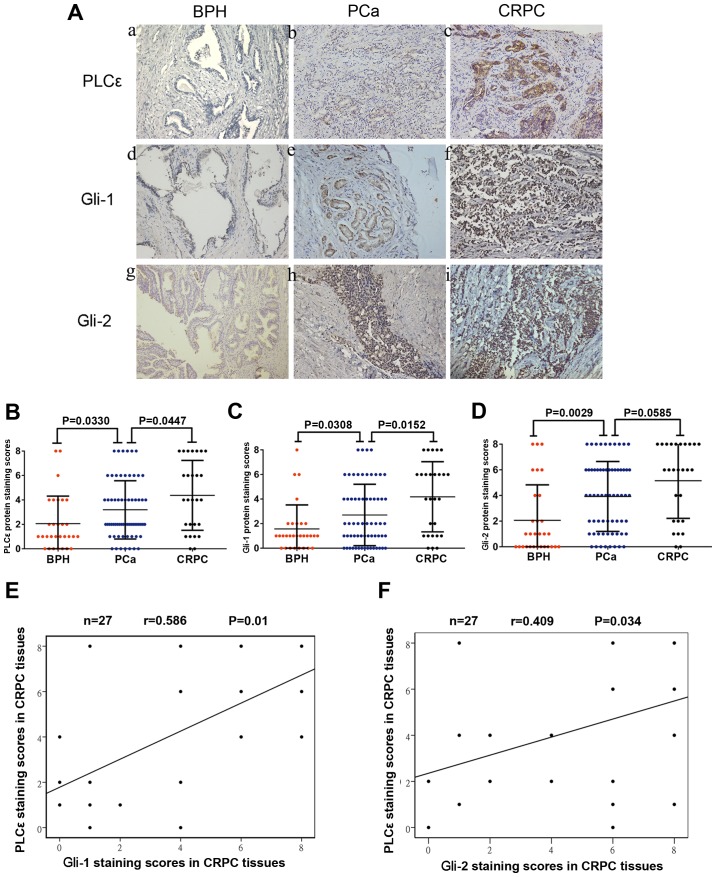
Figure 6.
Increased PLCε expression in PCa and CRPC tissues is associated with Gli-1/Gli-2 expression. (A) Immunohistochemical staining in prostate tissues. Magnification, ×200. (a, d and g) BPH tissues. (b, e and h) PCa tissues. (c, f and i) CRPC tissues. (B-D) Average staining scores for PLCε, Gli-1 and Gli-2 in BPH, PCa and CRPC tissues. (E and F) Correlation curve analysis for PLCε vs. Gli-1/Gli-2 staining scores in CRPC tissues. P<0.05 was considered statistically significant. PLCε, phospholipase Cε; BPH, benign prostatic hyperplasia; PCa, prostate cancer; CRPC, castration-resistant PCa; Gli, glioma-associated homolog.

