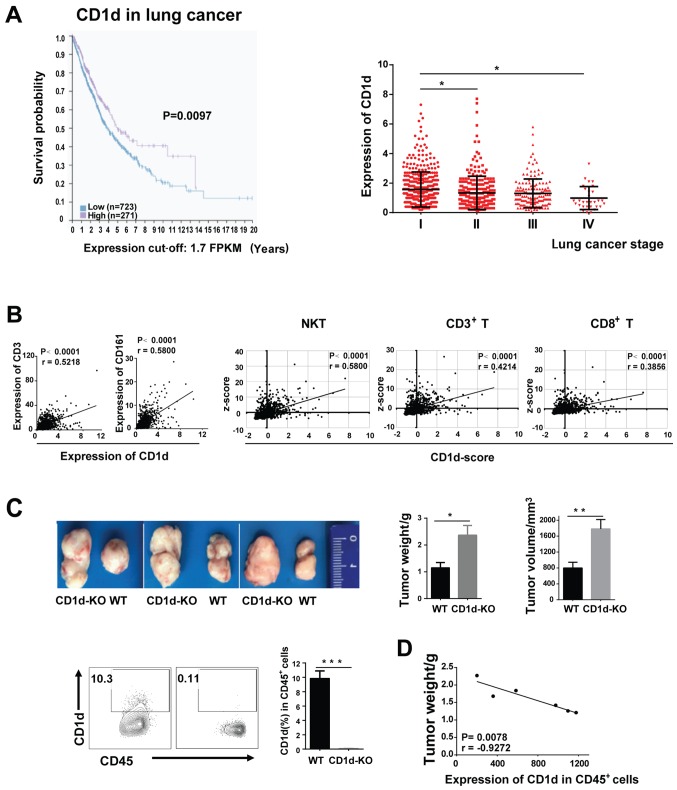
Figure 1.
The expression of CD1d is correlated with the extended survival of lung cancer patients. (A) The Kaplan-Meier plots summarized the correlation between the mRNA expression level of CD1d and lung cancer patient survival based on TCGA data. Patients were divided into one of two groups based on the level of CD1d; ‘low (n=723)’ or ‘high (n=271)’, cut-off was equal to 1.7FPKM. The TCGA data were derived from the Human Protein Atlas. CD1d expression was analyzed at different tumor stages (n=994). (B) The correlation between CD1d and the expression levels of CD161 and CD3 in lung cancer patients. The NKT cell score was calculated by combining the expression levels of CD161, CD3, CD69, GZMB, CD107a and IFN-γ; the CD3+T cell score was calculated by combining the expression levels of CD3, CD69, GZMB, CD107a and IFN-γ; and the CD8+T cell score was calculated by combining the expression levels of CD8, CD69, GZMB and CD107a. Pearsons correlation coefficient was performed. (C) The tumor weight and volume in CD1d-KO and WT tumor-bearing mice. The MFI value of CD1d was detected by flow cytometry. (D) Correlation analysis between the MFI value of CD1d on CD45+ cells (spleen) and tumor weight. Data presented in C and D are pooled from three independent experiments, each with 3–4 mice and expressed as the mean ± SEM. *P<0.05, **P<0.01, ***P<0.001. NKT, natural killer T; MFI, median fluorescence intensity; WT, wild-type; KO, knockout; SEM, standard error of the mean; FPKM, fragments per kilobase million.

