Figure 6.
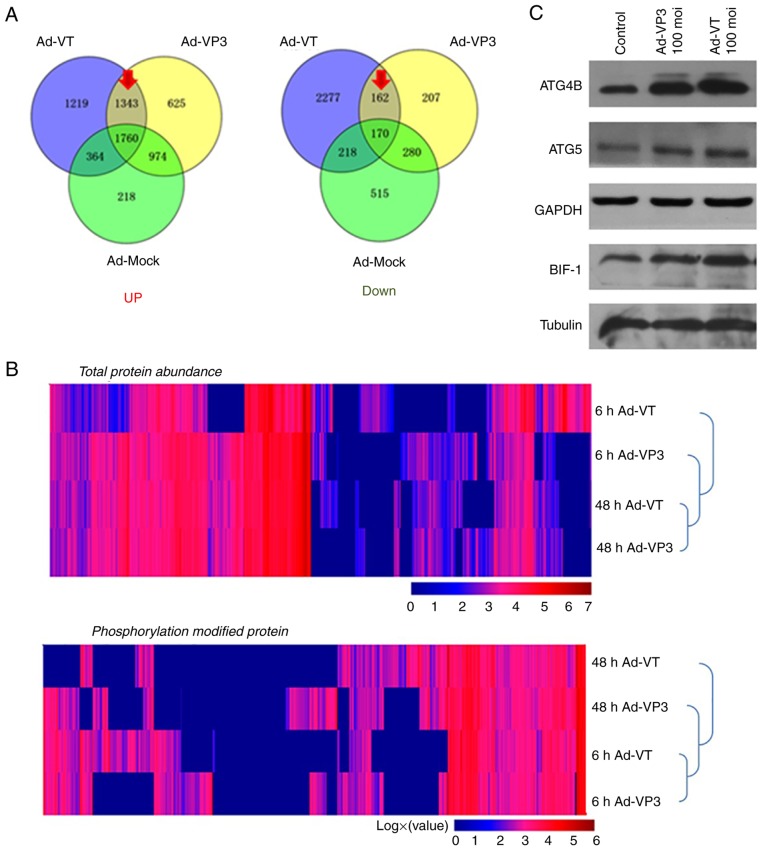
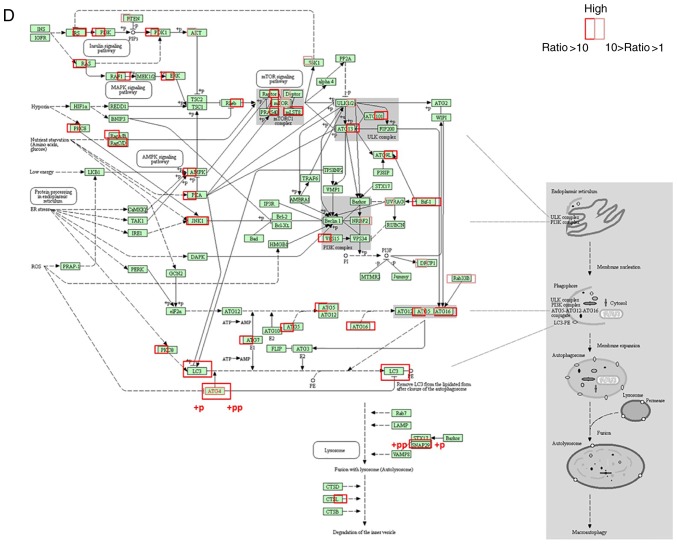
Proteomics confirmed that apoptin induces autophagy in MCF-7 cells. (A) Venn diagrams illustrating the identification of all proteins in MCF-7 cells. (B) Hierarchical clustering of unbiased total protein expression and hierarchical clustering of phosphorylated proteins. The pathways identified by proteomics suggested that apoptin induces autophagy. (C) Protein expression levels of ATG4b, ATG5 and BIF-1 were detected using western blotting. Proteomics confirmed that apoptin induces autophagy in MCF-7 cells. (D) Proteomic data revealed components of the autophagy signaling pathways. Proteins more abundant in Ad-VT-infected MCF-7 cells are shown in red (the ratio of Ad-VT/control was >10) and those that are a little more abundant in Ad-VT-infected MCF-7 cells are shown in pink (the ratio of Ad-VT/control was >1, but <10). Markedly elevated proteins are surrounded by a frame, indicating an increase in expression following Ad-VT and Ad-VP3 stimulation; when the left-hand side of the protein is framed this represents an increase in response to Ad-VT stimulation compared with the control group, whereas when the right-hand side of the protein is framed this represents an increase in response to Ad-VP3 compared with the control group. +p and +pp indicate the degree of phosphorylated protein expression; compared with the control group, +pp is more significant than +p. Ad-VP3, Ad-Apoptin; Ad-VT, Ad-Apoptin-hTERTp-E1a; MOI, multiplicity of infection.


