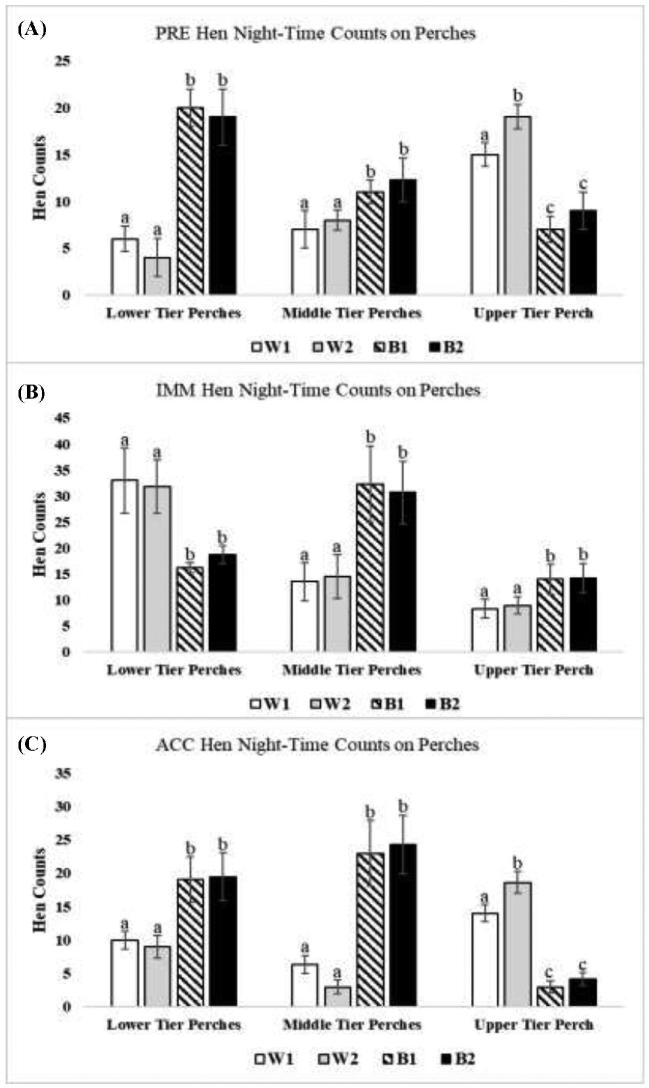
Figure 4.
Counts of hens of the 4 strains occupying perch space presented by tier of the aviary enclosure (W1 = DeKalb White, W2 = Hy-Line W36, B1 = Hy-Line Brown, and B2 = Bovans Brown). All parameters are expressed as the mean counts of hens ± SEM. Different superscripts indicate differences (P < 0.05) among different strains for that perch location.

