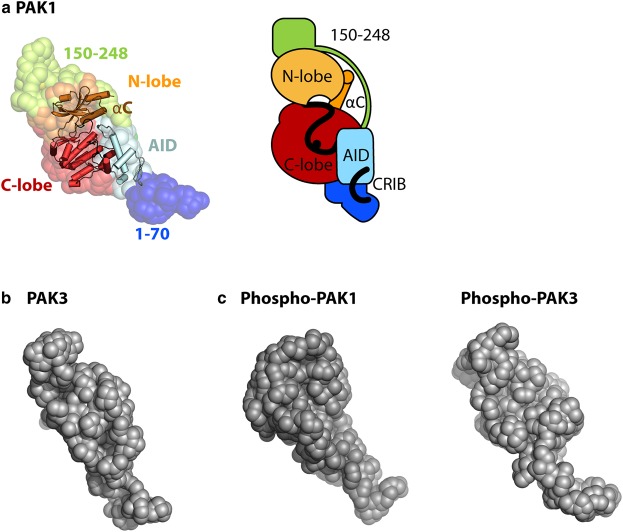
Figure 6. Hypothetical model of group A PAK auto-inhibition.
(a) PAK1 FL SAXS dummy residue model (spheres, left) superposed with the crystal structure of the PAK1 KD–AID complex (PDB 1f3m) and possible positioning of remaining PAK1 residues. (b) SAXS solution structure for PAK3 FL and (c) auto-phosphorylated PAK1 and PAK3 FL.

