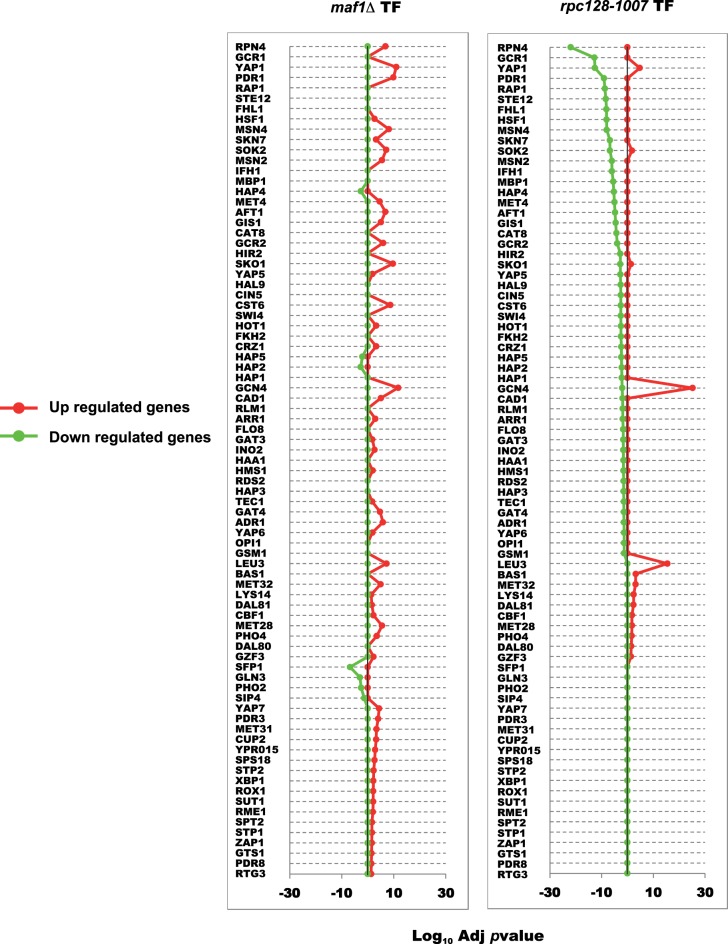
Figure 11. Transcription factor enrichment analysis.
Enrichment in the proteome sets for individual transcription factors was calculated using the GeneCodis website taking the sets of proteins with an adjusted P-value of <0.05 from both strains maf1Δ and rpc128-1007 compared against the wild-type. Proteins were classified according to their positive or negative fold change and the background set consisted of all proteins identified in the given MS experiment.

