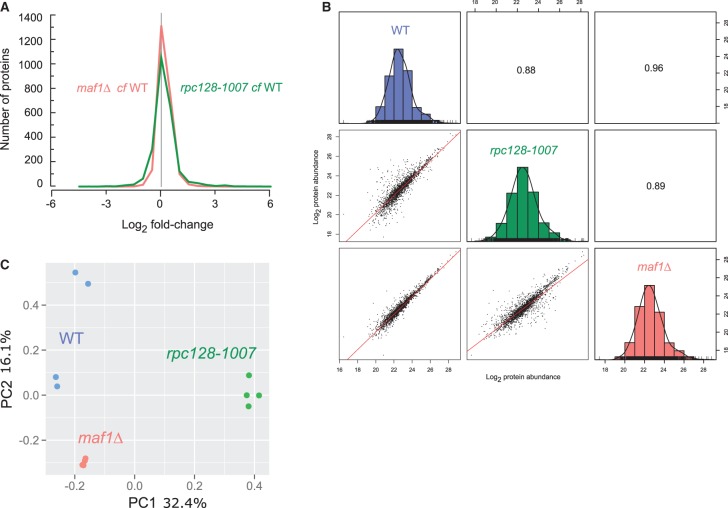
Figure 2. Proteome signature of maf1Δ and rpc128-1007 mutants compared with the wild-type strain.
(A) Histogram of proteins present on both mutants organized according to their corresponding Log2 fold change expression. (B) Comparative scatter plots and histograms of the different strains. The Log2 transformed protein abundances of proteins present in the WT, rpc128-1007 and maf1Δ strains are plotted against one another along with their distribution. The number shown is the Pearson correlation coefficient between the two relevant strains. (C) Principal component analysis (PCA) based on proteins present on all four biological replicates.

