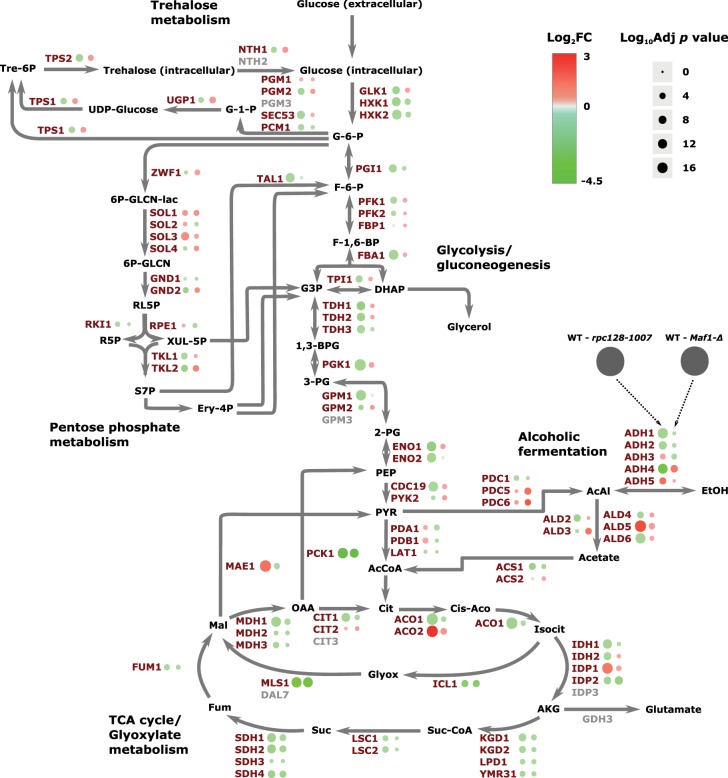
Figure 4. Comparative proteomic profiling of maf1Δ and rpc128-1007 mutants when compared with the wild-type strain.
The differences in protein abundances are presented on a schematic representation of the central carbon metabolism. Those proteins with an increased abundance are presented in red and those with a decreased abundance in green.

