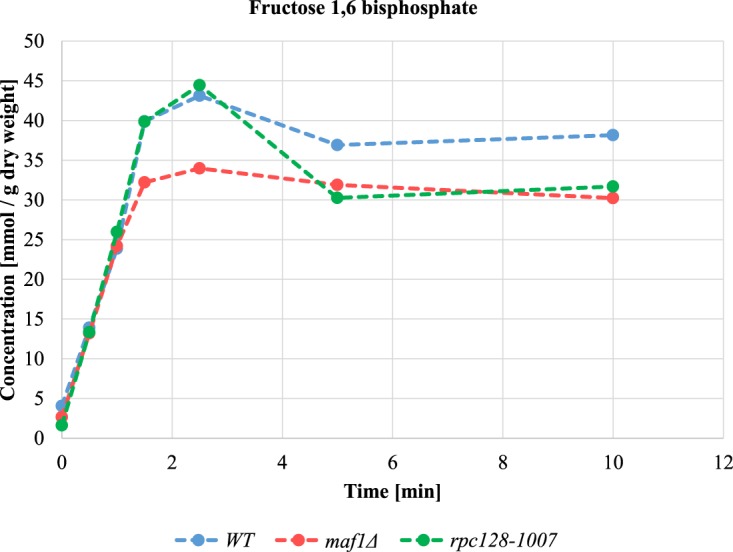
Figure 6. Changes in intracellular concentration of fructose 1,6-bisphosphate (F16BP).

Intracellular fructose 1,6-bisphosphate concentration is lowered in cells with changed RNAP III activity under glucose pulse experiment. Cells were grown in YPD until reaching D600 ≈ 1.0, collected washed in minimal medium lacking carbon source (CBS-C) and resuspended in CBS (-C). Analysis was performed in a thermostatted vessel at 30°C. Cells were flushed with Ar2 gas and glucose was added to a final concentration of 2%. Cell samples suspension were collected in time. Fructose 1,6-bisphosphate content was measured by enzymatic breakdown of NADH monitored by changed absorbance at 340 nm in time according to [4]. Fructose 1,6-biphosphate concentration was calculated from a standard curve and standardized to cells dry weight expressed in g. Results are shown as mean value for four biological replicates.
