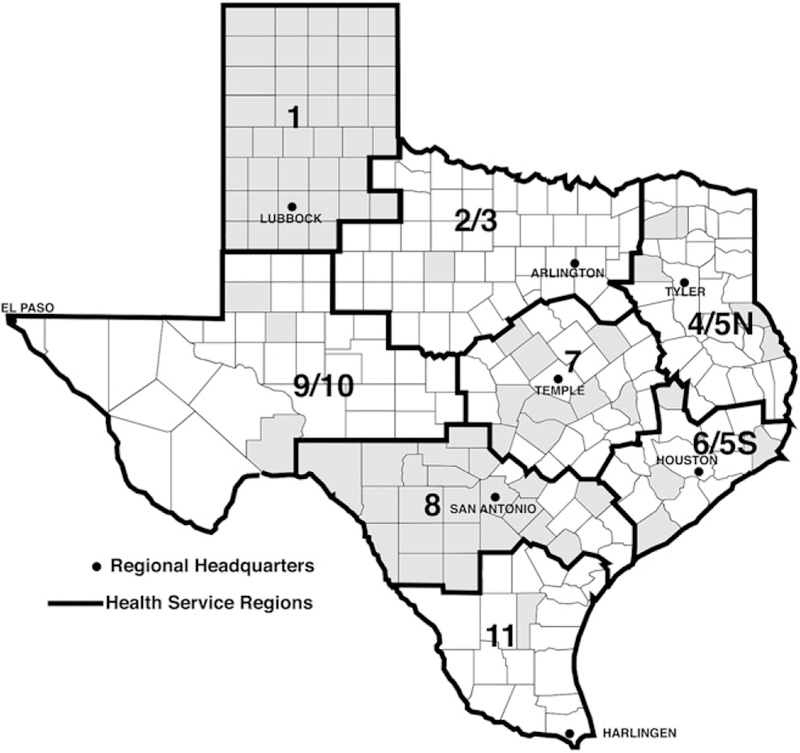
Figure.
Map of Texas Counties by Public Health Service Regions (http://www.dshs.state.tx.us/immunize/coverage/tcriss.shtm). Shaded Counties indicate that county-level vaccine coverage data were available and used in the county-level analysis. Vaccine Coverage data were available at the public health service region level for all regions.

