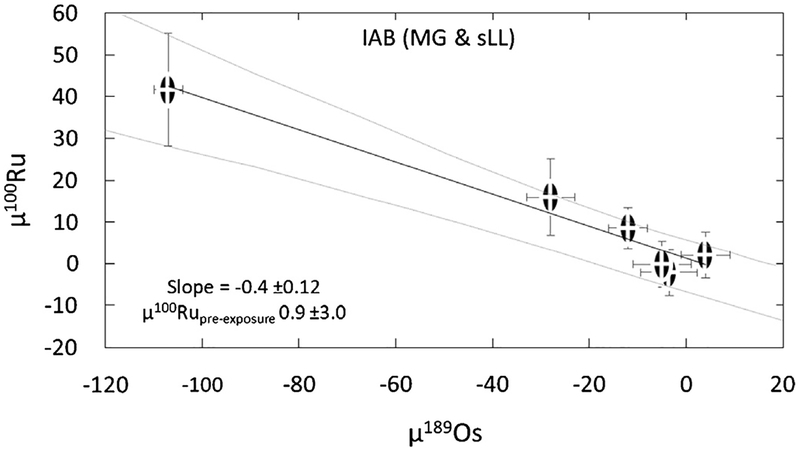
Fig. 2.
μ189Os vs. μ100 Ru for the lAB complex meteorites (Main Group and sLL subgroup). The dashed line is the linear regression through the meteorite data and the grey lines is the error envelope of the regression, both calculated using ISOPLOT (Ludwig, 2003).

