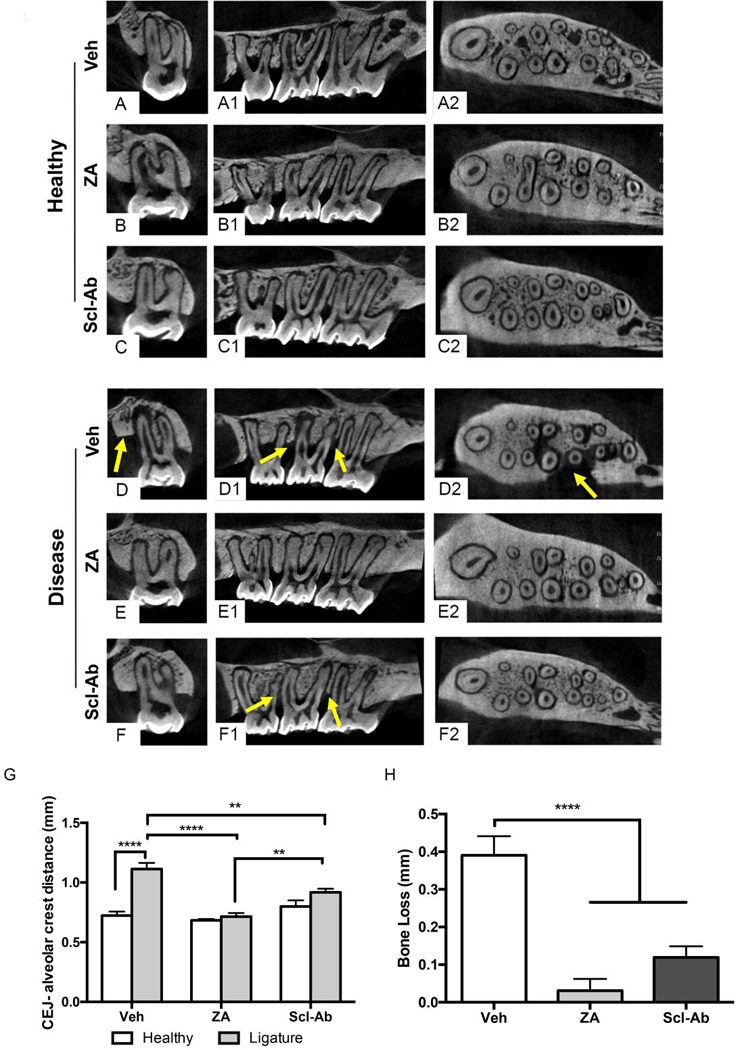
Figure 3: Radiographic Evaluation of Maxillae with EP.

Representative coronal, saggital, and axial μCT images of healthy maxillae in (A-A2) Veh, (B-B2) ZA, and (C-C2) Scl-Ab treated animals. Representative coronal, saggital, and axial μCT images of maxillae with EP in (D-D2) Veh, (E-E2) ZA, and (F-F2) Scl-Ab treated animals. Yellow arrows point to arrows of alveolar bone loss. (G) Quantification of CEJ-ABC distance in healthy and EP animals. (H) Quantification of alveolar bone loss. Data represents mean ± SEM: ****=p<0.0001, **=p<0.01.
