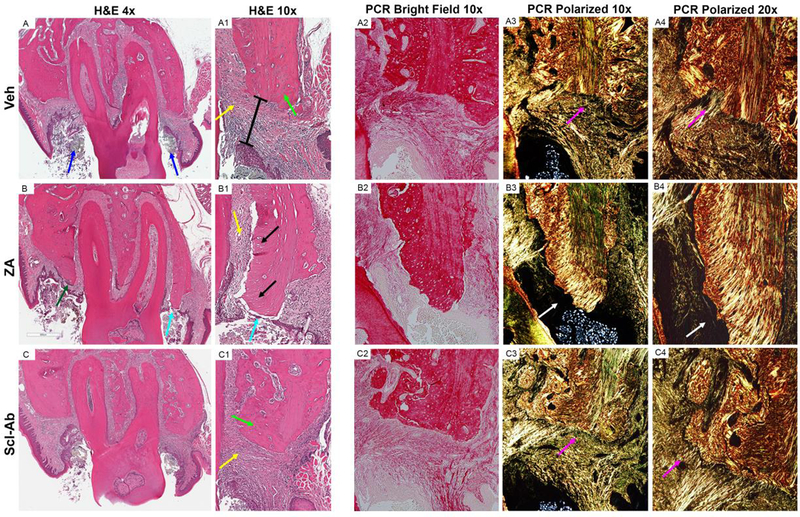
Figure 4: Histologic Analysis of Maxillae with EP.

Representative coronal H&E images of maxillae with EP in (A-A1) Veh, (B-B1) ZA, and (C- C1) Scl-Ab treated animals. (A) Low power magnification of Veh treated animals with magnification of the buccal cortex shown in (A1). Low magnification bright field (A2) and polarized images (A3) of Picrosirius red (PCR) staining of the palatal cortex. High powered magnification at the junction of the alveolar bone and connective tissue (A4). (B) Low power magnification of ZA treated animals with magnification buccal cortex shown in (B1). Bright field (B2) and polarized images of PCR staining of the palatal cortex (B3, B4). (C) Low power magnification of Scl-Ab animals with magnification buccal cortex shown in (C1). (C2) Bright field and (C3, C4) polarized images of PCR staining of the palatal cortex. Blue arrows point to the ligature. Yellow arrows point to areas of inflammatory infiltrate. Green arrows point to osteocytes within osteocytic lacunae. The black bar represents the epithelial to alveolar bone crest distance. Purple arrows point to the attachment of collagen fibers to the alveolar bone. Cyan arrows point to area of bone exposure. Black arrows points to empty osteocytic lacunae. White arrows point to an area void of collagen, adjacent to an area of osteonecrosis.
