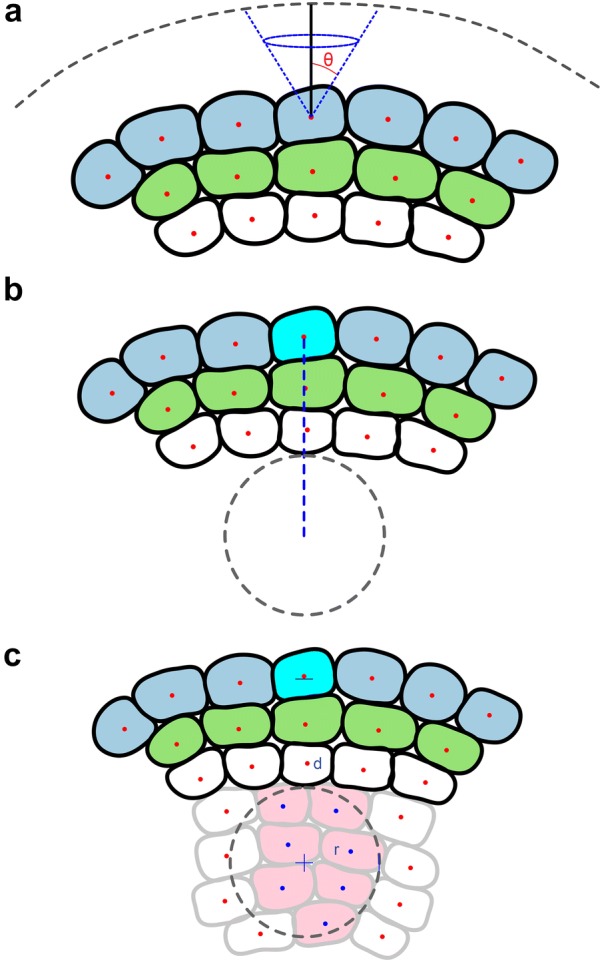
Fig. 2.

a Schematic illustrating the use of cones to define cell axes relative the surface of the SAM. b Definition of depth at which the organizing centre is identified indicated as a blue line. c The radius of cells comprising the organizing centre show in the grey dashed line, and selected cells in pink. Both the depth and radius used to identify these cells are defined by the user
