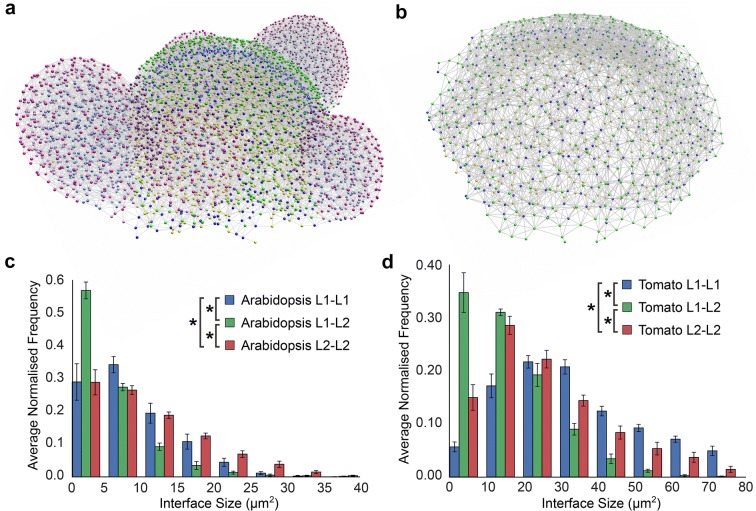
Fig. 6.
Topology of SAM layers, identified using 3DCellAtlasMeristem. a The Arabidopsis cellular connectivity network, with node coloured by cell type identified with 3DCellAtlasMeristem. b The tomato cellular connectivity network coloured by different cell layers. c Cell interface sizes within and between layers of the Arabidopsis SAM. d Same as c with the tomato SAM. An asterisk denotes significance at the p < 0.05 level (t test with Bonferroni corrected p value, p < 1.08 × 10⁻³)

