Fig. 4.
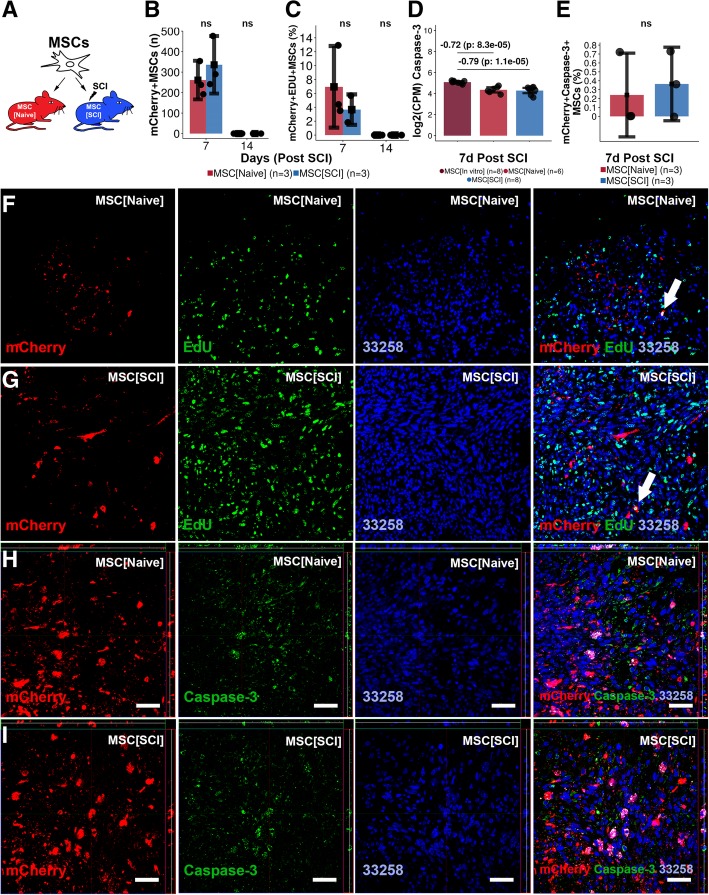
Survival, proliferation, and apoptosis of transplanted MSCs. a Experimental design. Transplanted MSCs were evaluated 7 and 14 days following transplantation. b Survival of transplanted mCherry+MSCs within the recipient. Mean surrounded by a 95% confidence interval. Each dot represents one biological replicate. Values are p values following independent two-group comparison between experimental groups. c Proliferation rate of transplanted mCherry+MSCs. Data reporting is as in b. d Log2(counts per million) for Caspase-3 gene following global transcriptional analysis of MSCs. Log2(fold change) and the FDR for contrasts: MSC[SCI] vs MSC[In vitro] and MSC[Naive] vs MSC[In vitro] are presented. Data reporting is as in b. e Estimation of the percentage of mCherry+Caspase-3+MSCs as compared to all mCherry+MSCs in spinal cords subjected to transplantation. f Co-expression of EdU and mCherry+MSCs in MSC[Naive] at 7 days post transplantation. g Equivalent in MSC[SCI]. h Co-expression of Caspase-3 and mCherry+MSCs in MSC[Naive] at 7 days post transplantation. i Co-expression of Caspase-3 and mCherry+MSCs in MSC[SCI] at 7 days post transplantation. ns not significant

