Fig. 1.
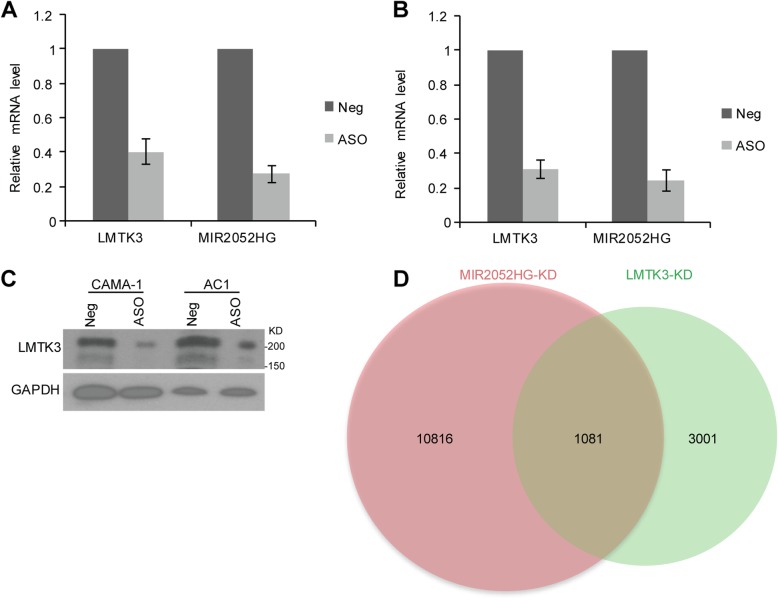
LMTK3 mRNA and protein expression in MIR2052HG knockdown cells. a–b Relative mRNA expression of LMTK3 after knockdown of MIR2052HG using pooled ASO in CAMA-1 (a) and MCF7/AC1 (b) cells. Error bars represent SEM; **p < 0.01 compared to baseline (negative control). c Western blots analysis of LMTK3 after knocking down MIR2052HG in CAMA-1 and MCF7/AC1 cell lines. d Venn diagram shows that genes affected by MIR2052HG knockdown from this study largely overlap with those published RNA-seq data after LMTK3-knockdown. MCF7/AC1 cells were transiently transfected with MIR2052HG ASO for 48 h. The RNA-seq data for LMTK3-knockdown were obtained from published data set [26]

