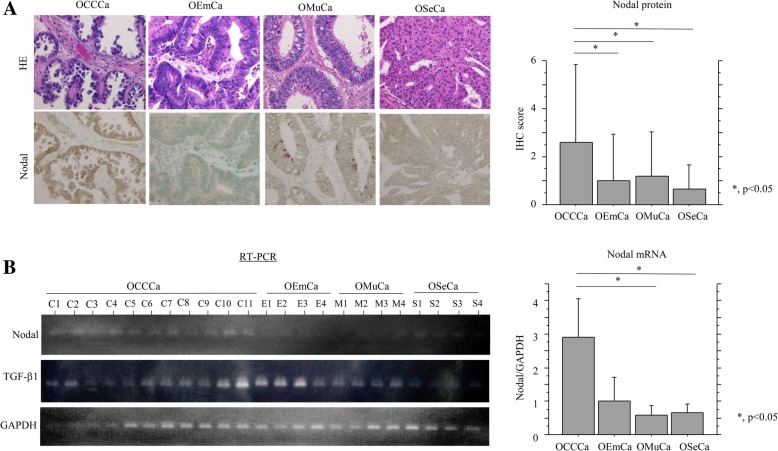
Fig. 1.
IHC and RT-PCR findings in OECas. a Left: staining by hematoxylin and eosin (HE) and IHC for Nodal in OECas. Note the immunopositivity for Nodal in OCCCa, in contrast to the weak or absent staining in non-OCCCas. Original magnification, × 200. Right: IHC score for Nodal in OECa. b Left: mRNA expression of Nodal and TGF-β1 in OECa by RT-PCR assay. Right: relative mRNA levels of endogenous Nodal in OECa were calculated by normalization to GAPDH using the NIH ImageJ program. The data shown are means ± SDs

